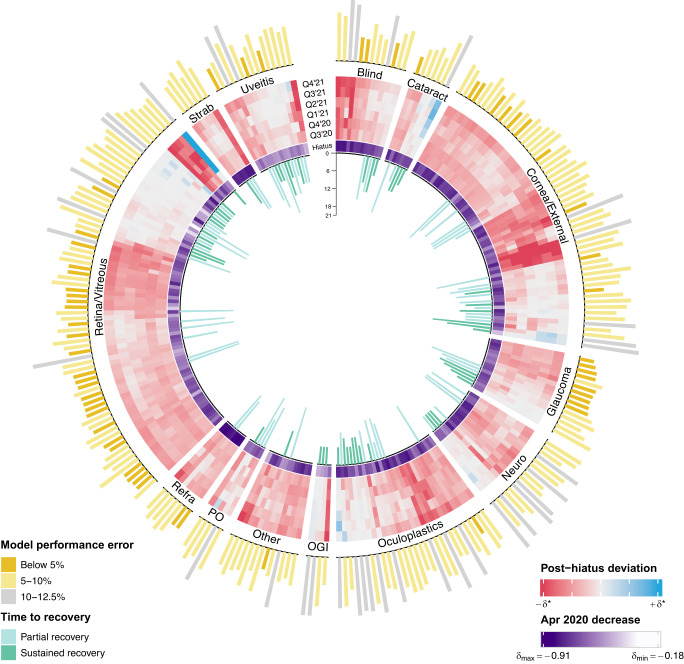
Fig. 6. High-dimensional characterization of pandemic care utilization patterns.
Patterns of pandemic care utilization over time are illustrated for all 261 diagnosis entities, partitioned by 13 diagnosis categories. Beginning with the innermost (first) ring, barplots represent the number of months, starting from January 2020, it took for each diagnosis entity to achieve partial or sustained recovery of patient volumes. The absence of a barplot denotes no recovery. The second ring depicts the raw values of the deviations for each condition during April 2020 (sequential color scale). In the third ring, a cluster heatmap shows diagnoses’ aggregate deviations for each quarter in the post-hiatus period, from the third quarter (Q3) of 2020 (innermost track of the heatmap) to the fourth quarter (Q4) of 2021 (outermost track), with the darkness of each heatmap cell a function of the product between the magnitude of the estimated quarterly deviation and the negative log of its adjusted p-value (diverging color scale). Diagnosis entities are clustered to group together conditions that exhibited similar patterns of post-hiatus deviations. In the outermost (fourth) ring, the magnitudes of each diagnosis entity’s counterfactual model performance error (RMSPE) are visualized as barplots. Abbreviations: Blind blindness and vision defects, Cataract cataract and other lens disorders, Cornea/External cornea and external disease, Neuro neuro-ophthalmology, Oculoplastics oculofacial plastics and orbital conditions, OGI ocular globe injury/intraocular foreign bodies, Other other specified eye disorders, PO postprocedural or postoperative eye complication, Refra refractive error, Retina/Vitreous retina and vitreous conditions, Strab strabismus, Uveitis uveitis and ocular inflammation, RMSPE root mean squared percentage error, Q1 first quarter, Q2 second quarter, Q3 third quarter, Q4 fourth quarter.

