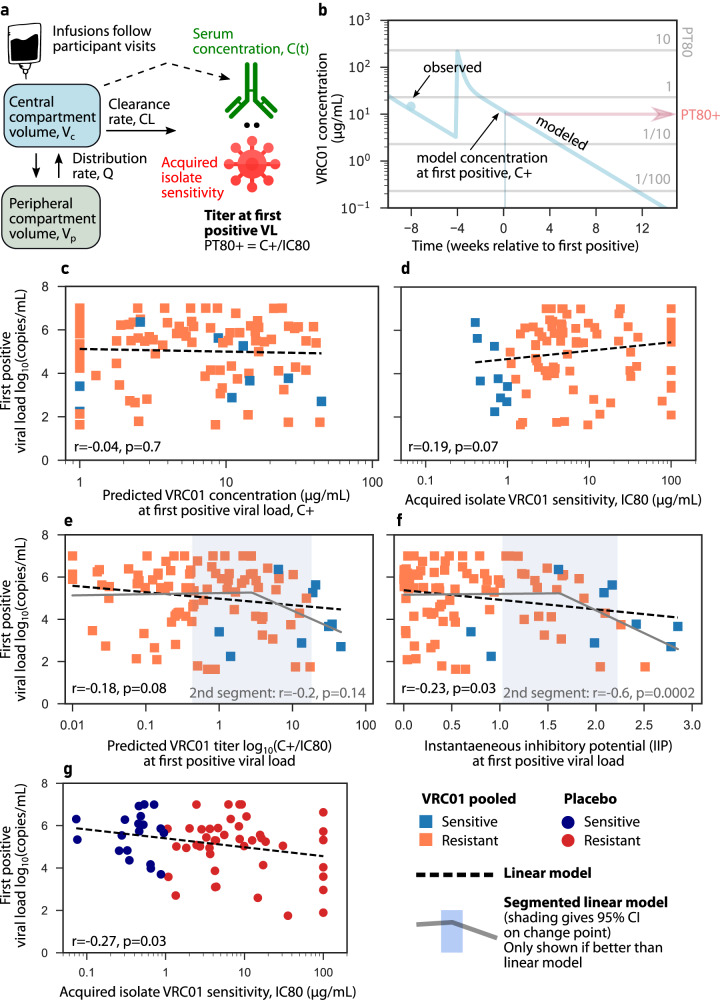
Fig. 3. Viral load is reduced directly by higher VRC01 activity and/or indirectly, e.g., via VRC01 resistant fitness costs.
a A two-compartment pharmacokinetic (PK) model trained on the present data–model structure was previously designed for VRC01 PK using an AMP case-control cohort (Supplementary Table 4)88. b Observed (dots) and modeled (line) VRC01 concentrations over time in a representative participant. The horizontal lines illustrate VRC01 concentrations corresponding to PT80 titers of 10, 1, 1/10 and 1/100 against the participant’s acquired isolate. c–g PK and combined PKPD activity visualized as “dose-response relationships” for variables against first positive viral load. c Projected VRC01 concentration at first positive viral load. d Acquired virus sensitivity to VRC01 in VRC01 pooled group. e Predicted 80% titer (PT80) at first positive. f Instantaneous inhibitory potential (IIP). g Acquired virus sensitivity to VRC01 in placebo group. Squares and blue/orange colors indicate sensitive/resistant VRC01 pooled participant data, whereas dots and navy/red colors indicate sensitive/resistant placebo participant data. Black dashed line is a linear regression line (Pearson correlation coefficient r and p-value noted in panel title). In e, f two-segment dose-response models described data better than the linear model. In those cases, the segmented model is shown as a solid gray line with a blue shaded 95% confidence interval around the change point of the segments.

