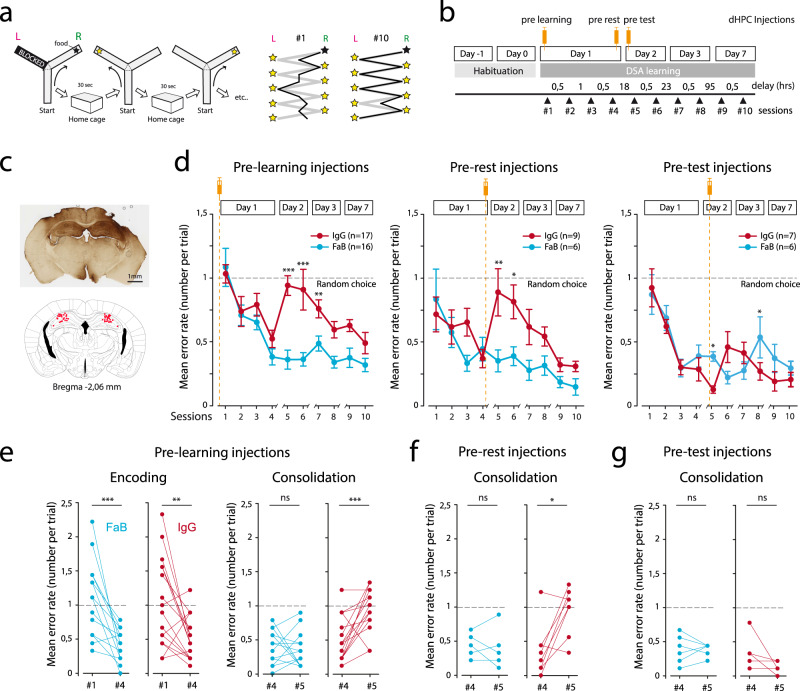
Fig. 1. AMPAR surface mobility in the dorsal hippocampus is necessary for the consolidation of a delayed spatial alternation rule.
a Schematic of the Delayed Spatial Alternation task. In each session, after an initial forced choice, nine food-rewarded positions—called trials, alternatively right and left—are set. Up to five error runs are permitted per trial before the animal is forced to enter in the rewarded arm. In between runs, the animal is positioned in its home cage for 30 s. After 10 training sessions (session #1 to #10) allocated within a week, animals are alternating almost perfectly (right panels). b Intracerebral bilateral injections in the dorsal hippocampus were performed at three different time points of the DSA training: pre-learning (before session #1), pre-rest (after session #4) and pre-test (before session #5) (orange syringes). c: Two cannulas were implanted above the dHPC, and anti-GluA2-IgGs or control compounds were injected. Template is from “the mouse brain” Paxinos and Franklin. d Behavioral results obtained in the various cohorts expressed as mean error rates. Injections of anti-GluA2 bivalent IgGs (red) or monovalent Fabs (blue) were performed as indicated. A two-way ANOVA was performed to analyze the effect of time and treatment on error rates. Statistically significant interaction between time and treatment was found for pre-learning injections (F(9,308) = 2.204, p = 0.022), but not for pre-rest (F(9,130) = 1.547, p = 0.138) and pre-test (F(9,110) = 1.632, p = 0.115) injections. FaB vs IgG pairwise multiple comparisons were done using the Holm–Sidak method. *p < 0.05, **p < 0.01, ***p < 0.001. e Single animal data are shown for crucial behavioral steps. Memory encoding (left) is achieved within the first day, the error rate being minimal at session #4 (d). Error rates between session #4 and session #5 are similar in FaB-injected control animals, but returned to chance level in IgG-injected mice. f, g Same presentation as in (e), but for consolidation—session #4 vs session #5—in pre-rest (f) and pre-test (g) injected cohorts. Paired t-tests were used. In case that sample distribution was not normal—after the Shapiro–Wilk test—a Wilcoxon ranked test was used. *p < 0.05, **p < 0.01, ***p < 0.001. n represents the number of injected animals. Data are presented as mean values ± SEM.

