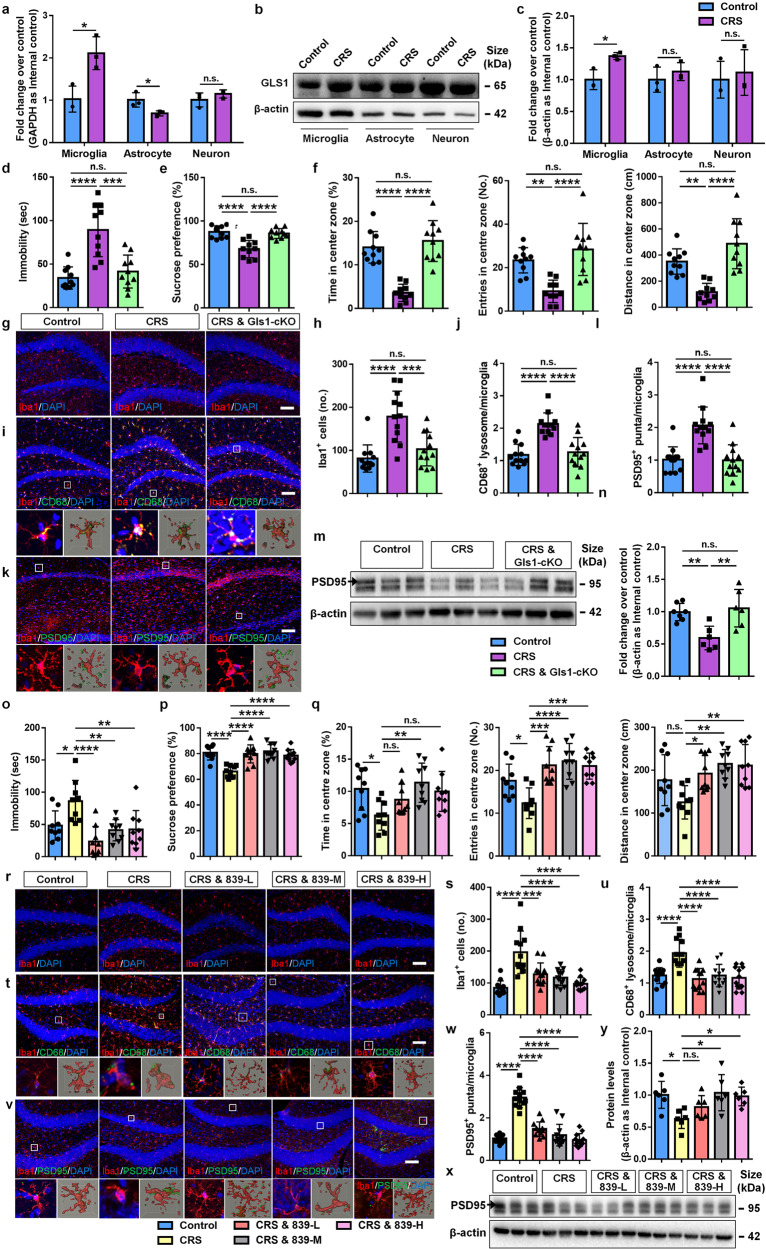
Fig. 1.
Microglial glutaminase 1 mediates chronic restraint stress-induced depression-like behaviors and synaptic damages. a qRT-PCR analysis for Gls1 mRNA expression in microglia, astrocytes, and neurons (n = 3, each dot indicates the sorted cells from 10 animals, unpaired t-test). b Representative blots for Gls1 protein expression in microglia, astrocytes, and neurons. c Quantification results of western blotting analysis (n = 3, each dot indicates the sorted cells from 10 animals, unpaired t-test). d Performance of control, CRS, and Gls1-cKO CRS mice in TST (n = 10 animals, one-way ANOVA). e Performance of control, CRS, and Gls1-cKO CRS mice in SPT (n = 10, one-way ANOVA). f Performance of control, CRS, and Gls1-cKO CRS mice in OFT (n = 10 animals, one-way ANOVA). g Representative images of Iba1 immunostaining (red) of microglia in the dorsal hippocampi of control, CRS, and Gls1-cKO CRS mice. h Quantification of Iba1+ cell numbers (n = 12 slides, 2 slides/animal, one-way ANOVA). i Representative images of Iba1 immunostaining (red) and CD68 immunostaining (green) of microglia in the dorsal hippocampi of control, CRS, and Gls1-cKO CRS mice. Magnification and 3D reconstructed images were placed below each panel. j Quantification of CD68+ lysosome numbers in Iba1+ cells n = 12 slides, 2 slides/animal, one-way ANOVA). k Representative images of Iba1 immunostaining (red) and Psd95 immunostaining (green) of microglia in the dorsal hippocampi of control, CRS, and Gls1-cKO CRS mice. Magnification and 3D reconstructed images were placed below each panel. l Quantification of Psd95+ puncta numbers in Iba1+ cells (n = 12 slides, 2 slides/animal, one-way ANOVA). m Representative blots for Psd95 protein expression in the hippocampi of control, CRS, and Gls1-cKO CRS mice. n Quantification results of western blotting analysis (n = 6 animals, one-way ANOVA). o Performance of control, CRS, and different doses (L: 3 mg/kg, M: 10 mg/kg, and H: 30 mg/kg) of CB839-treated CRS mice in TST (n = 9 animals, one-way ANOVA). p Performance of control, CRS, and different doses of CB839-treated CRS mice in SPT (n = 9 animals, one-way ANOVA). q Performance of control, CRS, and different doses of CB839-treated CRS mice in OFT (n = 9 animals, one-way ANOVA). r Representative images of Iba1 immunostaining (red) of microglia in the hippocampi of control, CRS, and different doses of CB839-treated CRS mice. s Quantification of Iba1+ cell numbers (n = 12 slides, 2 slides/animal, one-way ANOVA). t Representative images of Iba1 immunostaining (red) and CD68 immunostaining (green) of microglia in the dorsal hippocampi of control, CRS, and different doses of CB839-treated CRS mice. Magnification and 3D reconstructed images were placed below each panel. u Quantification of CD68+ lysosome numbers in Iba1+ cells (n = 12 slides, 2 slides/animal, one-way ANOVA). v Representative images of Iba1 immunostaining (red) and Psd95 immunostaining (green) of microglia in the dorsal hippocampi of control, CRS, and different doses of CB839-treated CRS mice. Magnification and 3D reconstructed images were placed below each panel. w Quantification of Psd95+ puncta numbers in Iba1+ cells (n = 12 slides, 2 slides/animal, one-way ANOVA). x Representative blots for Psd95 protein expression in the hippocampi of control, CRS, and different doses of CB839-treated CRS mice. y Quantification results of western blotting analysis (n = 6 animals, one-way ANOVA). Scale Bar: 100 μm (g, i, k, r, t, v). All data are represented as means ± s.d. ****p < 0.0001, ***p < 0.001, **p < 0.01, and *p < 0.05. n.s. non-statistical differences

