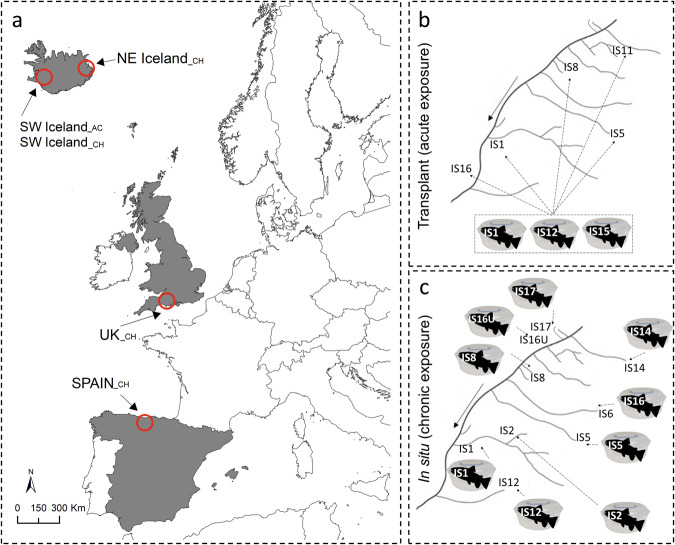
Fig. 1. Map of study sites and overview of acute versus chronic exposure assays.
a Locations of the study sites, incorporating five assay contexts: SW Iceland_CH, SW Iceland_AC, NE Iceland_CH, UK_CH, and Spain_CH (subscripts indicate whether chronic [CH] or acute [AC] temperature exposures were investigated). b Graphical representation of transplant (i.e. acute exposure) and (c) in situ (i.e. chronic exposure) fish respiration assays performed in the Hengill geothermal catchment. Streams are labelled with the same code used in previous studies65 and the solid arrows indicate water flow direction. In both assays, the stream code on the fish icon indicates the river where the fish was caught, and the dashed arrow denotes the river where respirometry assays were conducted. Note that fish from IS1, IS5, and IS12 were not “transplanted” to their own streams. The geographical delimitation for countries in (a) has been obtained through Natural Earth (www.naturalearthdata.com) under public domain. The fish silhouette in (b) and (c) was adapted from an image of Salmo trutta (by Carlos Cano-Barbacil) downloaded from PhyloPic (https://www.phylopic.org/) under CC0 1.0 Universal Public Domain Dedication.

