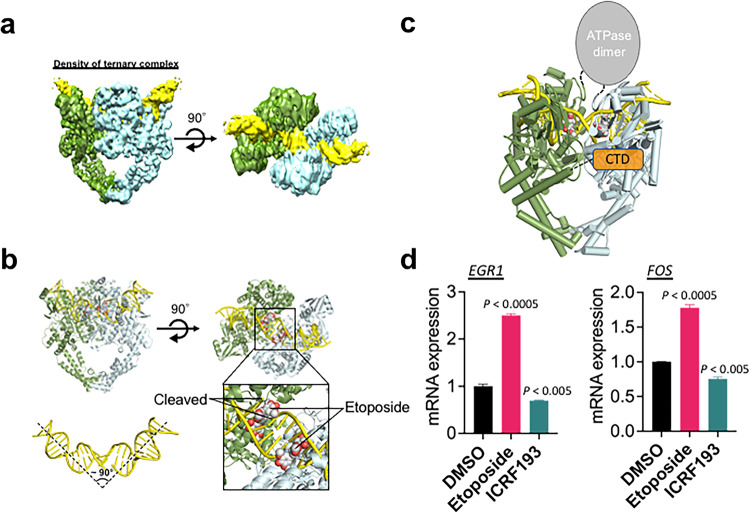
Fig. 4. Cryo-EM structure of the ternary complex of TOP2B-etoposide-EGR1 TSS.
a Density maps of the ternary complex in three different angles. Two TOP2B proteins shown in green and cyan, EGR1 TSS in yellow. b The ternary structure in ribbons. The DNA cleavage and etoposide binding sites, marked in a black box, are shown in close-up views. Two etoposide molecules are shown in sphere models, with the carbon and oxygen atoms colored white and red, respectively. The approximate angle of DNA bending is shown. c Schematic representation of the entire TOP2B protein. d qRT-PCR results indicating transcriptional activation and repression at the EGR1 and FOS genes in the HEK293 cells treated with etoposide and ICRF193, respectively (n = 3 biologically independent samples). Data are presented as mean values and SD. P values for the bar graphs were calculated with the unpaired, one sided Student’s t test. Source data are provided as a Source Data file.

