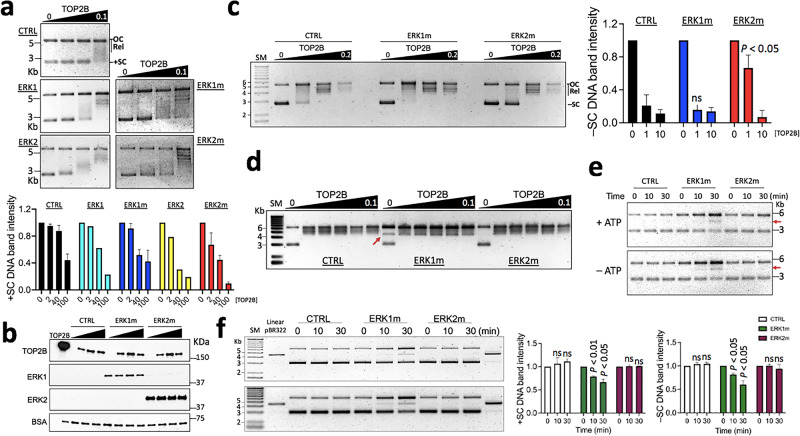
Fig. 5. ERK1 and ERK2 regulate TOP2B catalysis of DNA supercoiling in different manners.
a DNA relaxation assay results using positively supercoiled pBR322. The enzymatic reaction was allowed for 6 min before termination. TOP, representative agarose gel images showing the relaxation assay results. TOP2B concentrations shown in μM. OC, open circular DNA, Rel, relaxed DNA; +SC, positively supercoiled DNA. Bottom, a graph summarizing the relaxation assays (n = 3 independent experiments for CTRL, ERK1m, and ERK2m). TOP2B concentrations in nM. b Representative immunoblotting results showing the proteins used in the DNA relaxation assays. One tenth of a reaction was analyzed. TOP2B, 0, 2, 40, 100 nM; ERK1m and ERK2m, 20 nM. The loading control was TOP2B used for the reaction (TOP2B), 0.17 μM. c DNA relaxation assay results with negatively supercoiled pBR322. Left, a representative agarose gel image comparing CTRL, ERK1m, and ERK2m. –SC, negative supercoiled DNA. SM, DNA size markers in kilo base pairs (Kb). TOP2B concentrations in μM. Right, a graph summarizing the relaxation assay data (n = 3 independent experiments). TOP2B concentrations in nM. d DNA relaxation assay results. The reaction time was allowed for 30 min. CTRL and ERK2m reactions showing a similar relaxation pattern, whereas ERK1m reactions showing a unique middle-sized DNA band (marked with a red arrow) with or without TOP2B. e DNA relaxation assay results suggesting supercoiled DNA relaxation by ERK1m to accumulate OC/relaxed and linearized/partially-relaxed plasmid DNA (red arrows) with or without ATP. Time, reaction duration. f DNA relaxation assay with positively and negatively supercoiled pBR322. Left, representative agarose gels showing the assay results. ERK1m decreases both positive (upper gel) and negative (bottom gel) supercoiling in the time course. The middle band formed by ERK1m might be the linearized pBR322 as they run similarly. Right, graphs summarizing the relaxation assay data (n = 3 independent experiments). Data in (a), (c), (f) are presented as mean values and SD. P values for the bar graphs in (c) and (f) were calculated with the unpaired, one sided Student’s t test. Source data are provided as a Source Data file.

