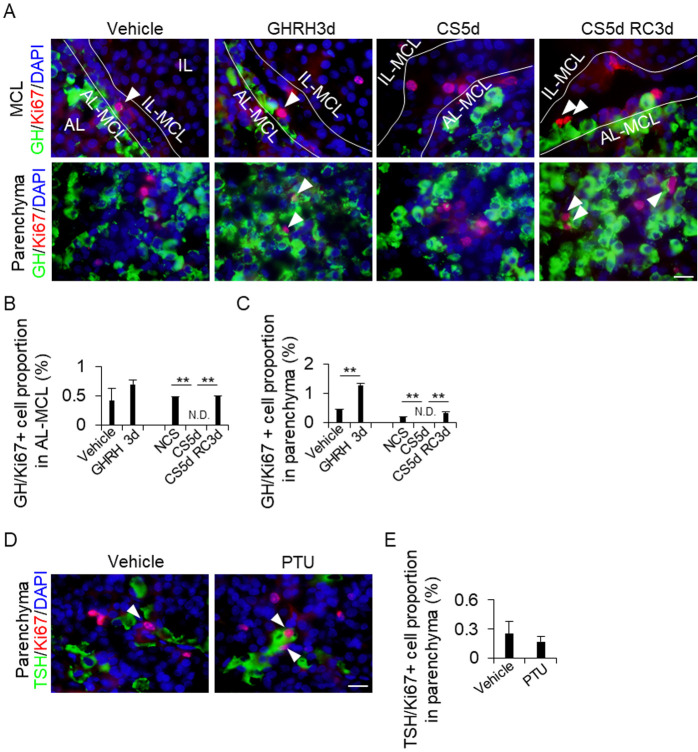
Fig. 5.
Proportion of GH/Ki67-positive cells in the IL-side and AL-side MCL and the AL parenchyma. (A and D) Double immunohistochemistry for GH (green) and Ki67 (red) in the vehicle, GH treatment for 3 days (GHRH3d), continuous stress for 5 days (CS5d), and recovery for 3 days after CS for 5 days (CS5d RC3d) (A), and for TSH (green) and Ki67 (red) in the vehicle and 2-week propylthiouracil treatments (PTU) (D). DAPI (blue) was added to identify the nuclei. White arrowheads indicate GH/Ki67- (A) or TSH/Ki67-positive cells (D). (B, C and E) Proportion of GH/Ki67-positive cells from the DAPI-positive cells in each treatment. The cells were counted in the AL-side MCL (AL-MCL; B) and AL parenchyma (Parenchyma; C and E). AL, anterior lobe; IL, intermediate lobe; MCL, marginal cell layer; IL-MCL, IL side of the MCL. Scale bars: 20 μm (A and B). ** P < 0.01.

