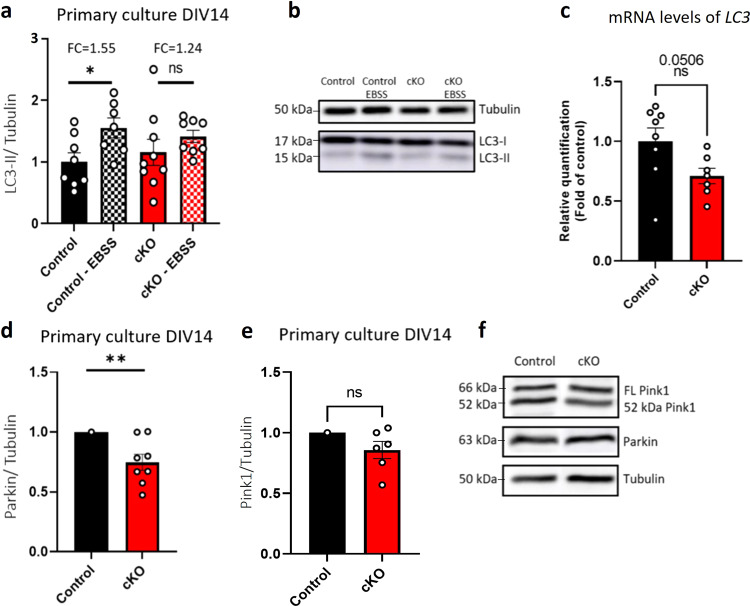
Fig. 6. Autophagy and mitophagy levels are altered in cKO mice, as compared to controls.
Primary cortical cultures from P1 cKO and control mice were seeded. After 14 days, proteins were separated by SDS-PAGE and subjected to immunoblot, using the indicated antibodies. a Autophagy was measured by examining the levels of LC3 protein in the primary cortical cultures. A significant increase in the LC3-II/Tubulin ratio was seen under stress condition (3 h EBSS starvation) in the case of control cells, yet no significant such changes were seen with cKO mouse cultures (*P = 0.025). b Representative results of anti-LC3 antibody staining. c mRNA levels of LC3 are lower in homogenate cortex of cKO as compared to control mice at P1 (P = 0.0506). d Mitophagy was measured by examining Parkin protein levels. A significant reduction was detected in cKO cultures (**P = 0.006), while e assessing Pink1 protein levels revealed no significant changes (ns) between the two cultures. f Representative staining by the indicated antibodies. Statistical significance was determined by a, c Unpaired t-test and d, e One sample t-test. a n = 8 control mice, n = 7 control mice subjected to EBSS stress, n = 8 cKO mice, n = 8 cKO mice subjected to EBSS stress, c n = 8 control mice, n = 7 cKO mice. d n = 7 control mice, n = 8 cKO mice, e n = 7 control mice, n = 6 cKO mice. Values represent means ± SEM. ns non-significant, FC fold change, FL full length.

