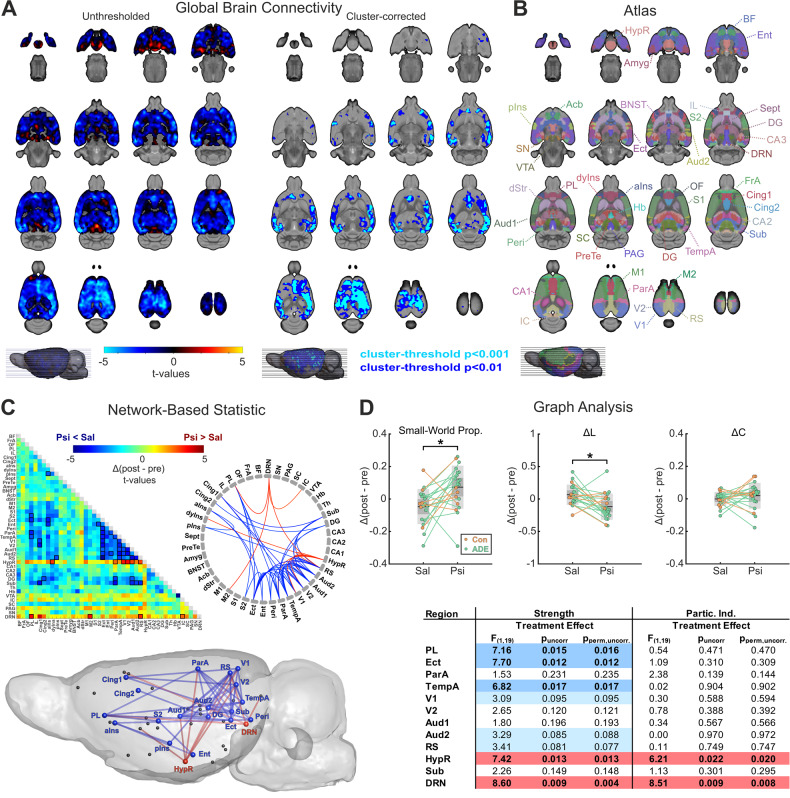
Fig. 2. Global brain connectivity (GBC), network-based statistic (NBS) and graph analysis (GA) demonstrate psilocybin-induced treatment effects on whole-brain network functioning.
A The left panel demonstrates an unthresholded t-value map for the post-hoc analysis of the within-subject treatment condition (starting 18 min after subcutaneous psilocybin administration) comparing psilocybin to placebo (n = 21 rats, crossover design). Regions exhibiting reduced GBC under psilocybin are indicated in blue to light blue, while red to yellow indicate regions with increased GBC. The right panel illustrates areas surviving cluster-correction (pFWE cluster-corrected < 0.05) with a cluster-defining threshold of t > 2.53 (dark blue, cluster-size ≥ 7998 voxels, corresponding to pCDT < 0.01) and t > 3.55 (light blue, cluster-size ≥ 45 voxels, corresponding to pCDT < 0.001), respectively. For exact cluster sizes, see Supplementary Excel File “Overview_Statistics.xlsx”. B shows atlas regions considered for region-of-interest-based parcellation in functional MRI analyses. C NBS results comparing functional connectivity alterations 18 min after psilocybin administration to placebo demonstrate a pattern of strong psilocybin-induced cortical hypoconnectivity (blue), while hypothalamus and dorsal raphe nucleus revealed opposing hyperconnectivity (red, pNBS < 0.01; primary threshold Fpt > 7.31, corresponding to ppt < 0.01). Data are illustrated in clockwise manner in a connectivity matrix as t-values (psilocybin vs saline) with black boxes marking the connections of the cluster surviving the NBS, a connectogram and a sagittal brain view. D Graph analysis showed increased small-world propensity after psilocybin administration when compared to saline (F1,19 = 6.049, pFDR-corrected = 0.024, pperm,FDR-corrected = 0.016). The deviation of the network’s characteristic path length (ΔL, from both lattice and random networks constructed with the same number of nodes and the same degree distribution, F1,19 = 6.524, pFDR-corrected = 0.020, pperm,FDR-corrected = 0.014) was significantly decreased after psilocybin administration, predominantly driving the changes in small-world propensity, while no differences could be found for the deviation of the clustering coefficient (ΔC, F1,19 = 1.388, p = 0.254, pperm = 0.269). The table of F- and p-values (parametric and non-parametric) for within-subject treatment effects of local graph metrics (strength and participation index, all p-values are uncorrected for multiple comparisons, bottom-right) derived from a repeated measures ANOVA shows a pattern of significant decrease (puncorrected < 0.05) upon psilocybin administration for strength in PL, Ect, and TempA, while HypR and DRN demonstrate increased strength and participation index, similar to the pattern found in NBS. Only local graph metrics with at least four significantly altered connections in the NBS are shown. Blue color indicates lower and red color indicates higher values after psilocybin administration in comparison to placebo. For a table of all local graph metrics, see Supplementary Excel File “Overview_Statistics.xlsx”, sheet “Local Graph Metrics”. BF basal fore brain, FrA frontal association cortex, OF orbitofrontal region, PL prelimbic cortex, IL infralimbic cortex, Cing1 cingulate cortex area 1, Cing2 cingulate cortex area 2, aINs agranular insular cortex, dyIns dysgranular insular cortex, pIns posterior insular cortex, Sept septum, PreTe pretectal region, Amyg amygdala, BNST bed nucleus of stria terminalis, Acb accumbens, dStr dorsal striatum, M1 primary motor cortex, M2 secondary motor cortex, S1 primary somatosensory cortex, S2 secondary somatosensory cortex, Ect ectorhinal cortex, Ent entorhinal cortex, Peri perirhinal cortex, ParA parietal associative cortex, TempA temporal associative cortex, V1 primary visual cortex, V2 secondary visual cortex, Aud1 primary auditory cortex, Aud2 secondary auditory cortex, RS retrosplenial cortex, HypR hypothalamus region, CA1-CA3 fields CA1-CA3 (cornu ammonis) of hippocampus, DG dentate gyrus, Sub subiculum, Th thalamus, Hb habenula, VTA ventral tegmental area, IC inferior colliculus, SC superior colliculus, PAG periaqueductal gray, SN substantia nigra, DRN dorsal raphe nucleus, Psi psilocybin, Sal saline, Δ(post-pre) difference between post-injection and pre-injection values, ADE alcohol deprivation effect rats (n = 15), Con control rats (n = 6), *p < 0.05.

