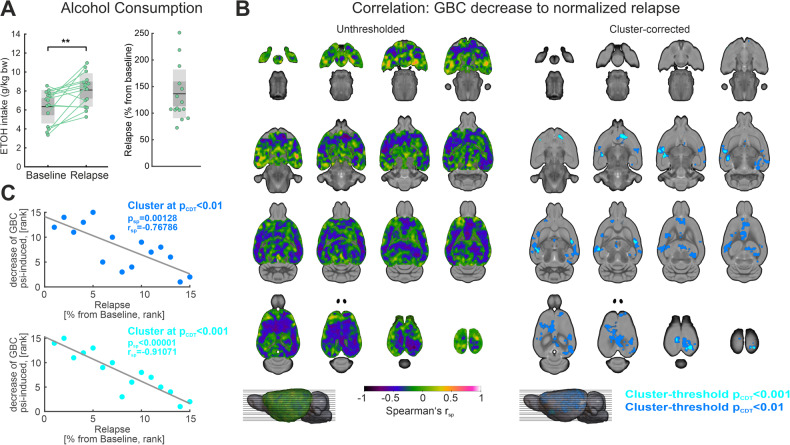
Fig. 4. Correlations of global brain connectivity (GBC) decrease to alcohol relapse intensity in the ADE group.
A Alcohol consumption was significantly higher during relapse when compared to baseline (p < 0.01; average ETOH intake at baseline (mean ± SD): 6.35 ± 1.75 g/kg bodyweight; average ETOH intake at relapse (mean ± SD): 8.10 ± 1.74 g/kg bodyweight). The right panel illustrates the percentual change of alcohol consumption (from baseline) during relapse. B The left panel shows an unthresholded map of correlation coefficients (Spearman’s rsp), which are voxel-wise calculated between the GBC decrease of the 15 ADE rats and their normalized relapse intensities. Areas of strongly negative correlation coefficients are illustrated in blue to violet. The right panel demonstrates the regions surviving cluster correction (pFWE cluster-corrected < 0.05; cluster-defining threshold t > 2.65 corresponding to pCDT < 0.01, dark blue; cluster-defining threshold t > 3.85 corresponding to pCDT < 0.001, light blue), covering predominantly posterior and anterior cortical regions of the DMN, somatosensory areas and the ventral striatum. Correlation coefficients were transformed to t-values prior to cluster-correction. C Scatter plot illustrating the association between relapse intensity and mean decrease of GBC in the respective clusters (pCDT < 0.01, dark blue, pCDT < 0.001, light blue). ADE alcohol deprivation effect rats (n = 15); CDT cluster defining threshold, ETOH ethanol, FC functional connectivity, Psi psilocybin, Sal saline, SD standard deviation, **p < 0.01. For abbreviation of brain regions, see Fig. 2. Prior to calculation of correlation coefficients, connectivity metrics for psilocybin and saline were first compared to its respective baseline, and then subtracted from each other, resulting in ΔSal-Psi values which reflect the decrease of FC.

