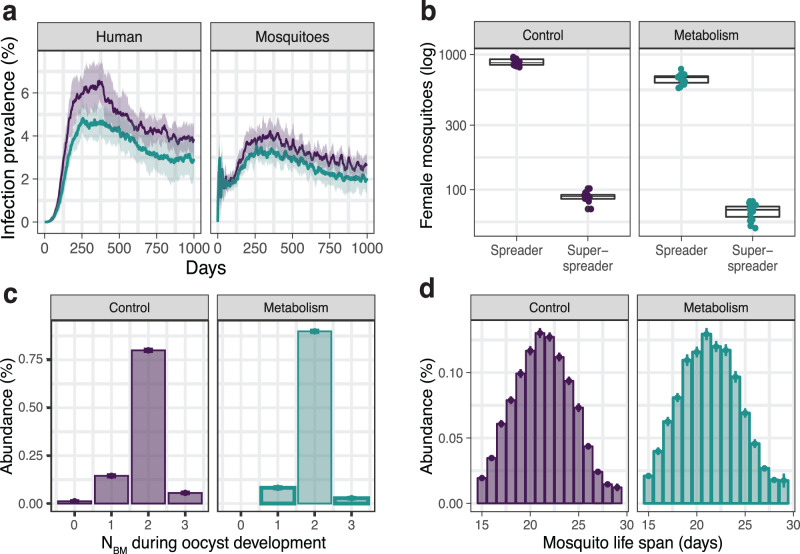
Fig. 2. Model of Plasmodium transmission including mosquito metabolism.
Summary of N = 15 stochastic simulations excluding (control simulations depicted in purple) or including the effects of mosquito metabolism (cyan). a Infection prevalence given by the percentage of novel infections in humans and mosquitoes. The solid line depicts the mean and the shaded areas—the standard deviation. b Number of spreaders and super-spreaders throughout the entire simulation as defined in Supplementary Fig. 1. c Distribution of the number of blood meals acquired by single mosquitoes (spreaders and super-spreaders) during oocyst development. d Age distribution of spreaders and super-spreaders. Bar plots show the mean, and error bars—the standard deviation. Box plots depict the median with first and third quartile, whiskers depict min and max values.

