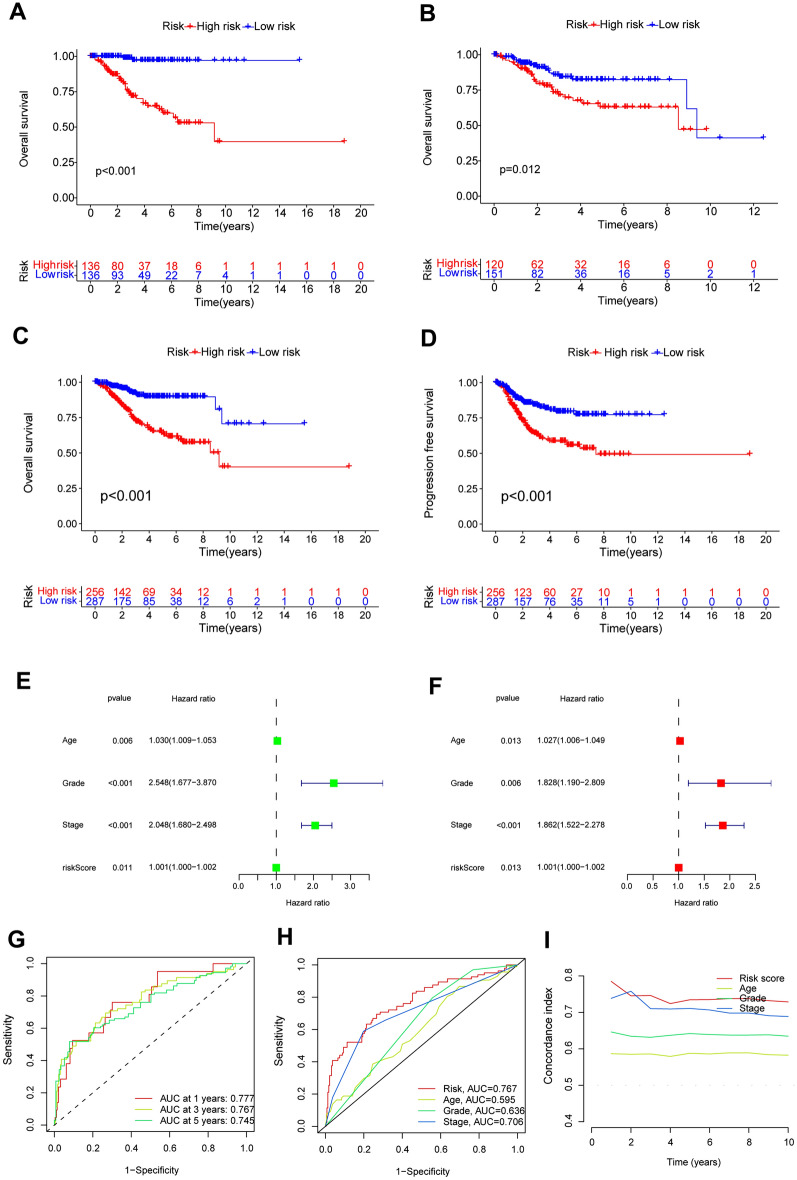
Figure 5.
Validation of the accuracy of the model from multiple perspectives. (A–C) KM curves of OS in the Train, Test, and All groups. (D) KM curves of PFS in the All group. (E, F) Univariate and multivariate Cox analysis suggesting that risk score is an independent prognostic factor for UCEC. (G) DALPMs predicts 1-, 3-, and 5-year survival rates in patients with UCEC. (H) The ROC curve showing that risk scores have better predictive power compared with other clinical factors. (I) The C-index showing that risk scores have better predictive power compared with other clinical factors.

