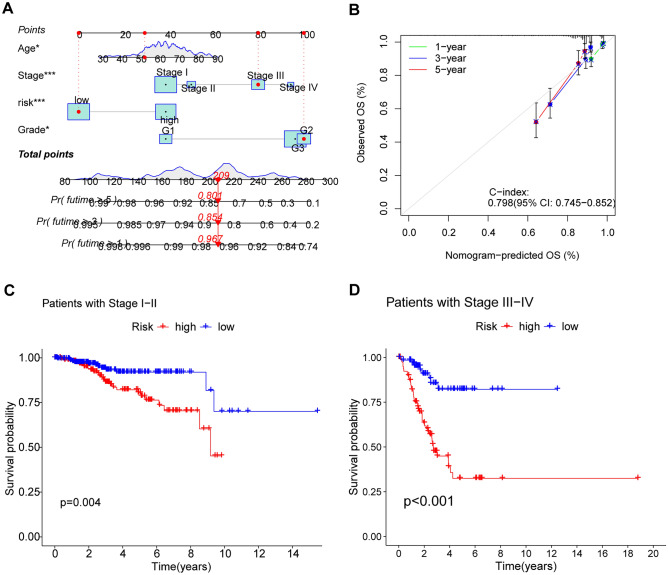
Figure 6.
Construction of the nomogram and exploration of the correlation between risk scores and the clinical stage of UCEC. (A) The nomogram showing that clinical factors, including risk scores, can be scored to predict the survival of patients at 1, 3, and 5 years. (B) The calibration curve showing sufficient consistency between the actual results and the predicted results. (C, D) differences in survival between high and low risk groups of patients at different stages.

