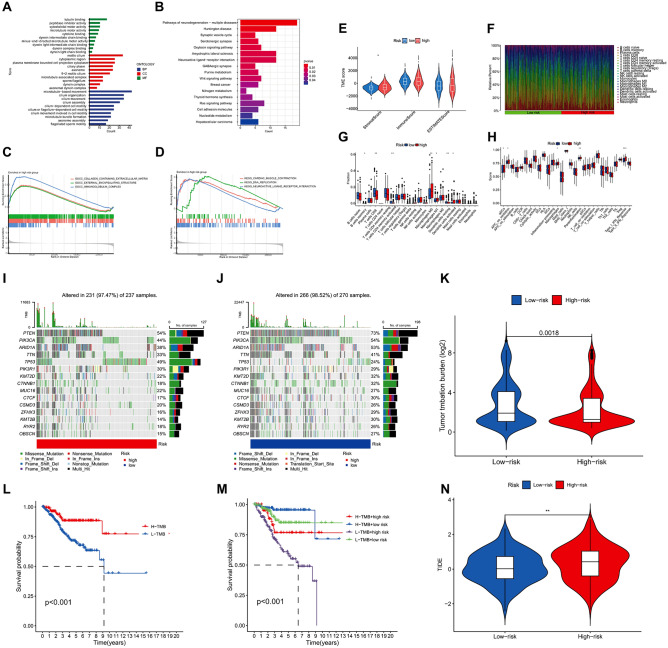
Figure 7.
The results of GO, KEGG, GSEA, TME, immune invasion TMB, and TIDE analyses. (A) GO enrichment analysis revealed the top 10 biological functions in BPs, CCs, and MFs. (B) KEGG analysis revealed significantly enriched pathways. (C, D) GSEA analysis revealed the biological functions and pathways of the high risk group located in the top three. (E) Differences in stromal cells in patients in high and low risk groups. (F) Abundance of immune cell infiltration in all patients. (G, H) Differences in immune cells (B cells memory, T cells CD8, T cells CD4 memory activated, macrophages M0, macrophages M1, dendritic cells resting, and dendritic cells activated) and immune-related pathways (aDCs, APC co-inhibition, macrophages, parainflammation, and Type I IFN Response) in patients in high and low risk groups. (I, J) Somatic mutation in the high and low risk groups. (K) Differences in TMB between the high and low risk groups. (L) A significant difference in survival between the high and low risk groups of patients with TMB was observed. (M) Patients with low TMB and high risk have the worst survival. (N) Differences in TIDE between patients in the high and low risk groups were observed. *p < 0.05, **p < 0.01, ***p < 0.001.

