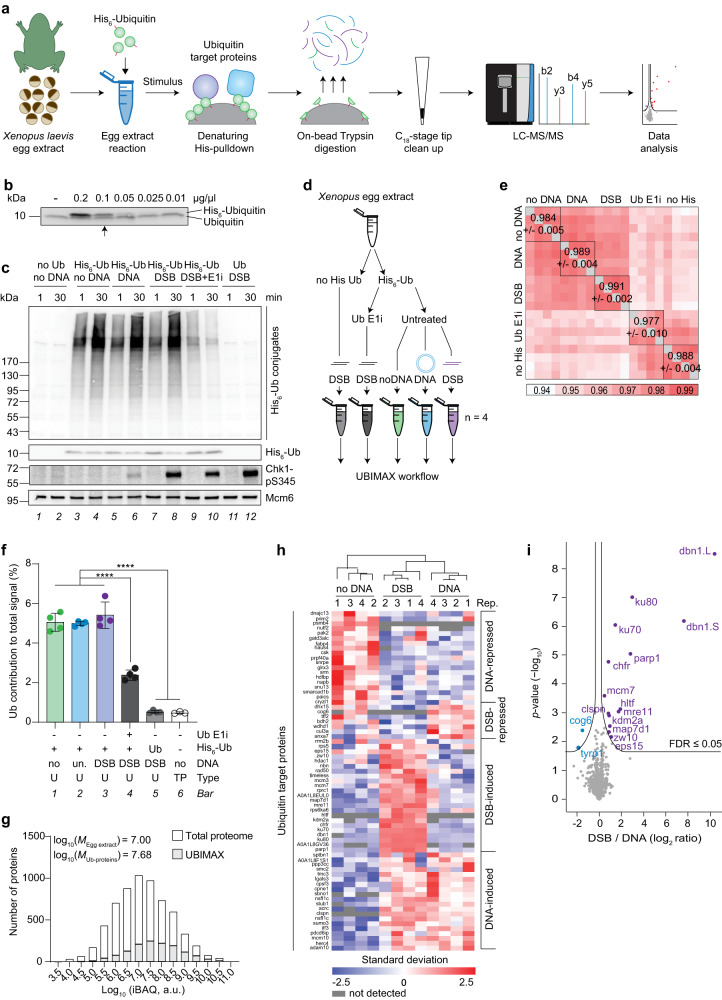
Fig. 1. UBIMAX efficiently and specifically detects ubiquitin-conjugated proteins in response to DSBs.
a Schematic representation of UBIMAX experimental system and workflow. LC-MS/MS; liquid chromatography-tandem mass spectrometry. b His6-ubiquitin was added to extracts at indicated concentrations and analysed by western blot. Arrow indicates concentration of His6-ubiquitin, 0.1 µg/µL, used in subsequent experiments. c, d Extracts were supplemented with DMSO or ubiquitin E1 inhibitor (“E1i”) prior to addition of untagged ubiquitin (“Ub”) or His6-Ubiquitin (“His6-Ub”). Reactions were initiated by addition of buffer (“no DNA”), undamaged plasmid DNA (“DNA”) or linearized plasmid DNA (“DSB”). Samples were analysed by western blot (c) 1 or 30 min after reaction initiation. UBIMAX (experimental outline in d) was performed in independent reaction quadruplicates. Samples were harvested at 30 min and subjected to the UBIMAX workflow outlined in a. no His Ub, untagged ubiquitin; Ub E1i, ubiquitin E1 inhibitor. e Pearson correlation matrix of the experiment outlined in d. Within-replicate mean and ±standard deviation is indicated. no His, untagged ubiquitin. f Mean percent contribution of ubiquitin peptides to summed peptide abundance for UBIMAX samples (“U”), derived from quadruplicate independent reactions, and three biologically independent replicates of a total extract proteome (“TP”). Error bars represent standard deviations. Significance was determined by one-way ANOVA with Tukey’s multiple comparisons test for all pairwise comparisons, with those indicated of p-values ˂ 0.0001. no, no DNA; un., undamaged plasmid DNA. g Depth of sequencing illustrated as distribution of log10(iBAQ)-values of ubiquitylated proteins detected by UBIMAX compared to proteins detected in a total extract proteome. Frequency distribution medians (“M”) are shown at the top left corner. iBAQ, intensity-based absolute quantification; a.u., arbitrary units. h Hierarchical clustering analysis of Z-scored ubiquitylated protein abundances robustly changing with DNA treatment. Gene names are provided on the left (or UniProtID if unannotated). Rep., replicate. i Volcano plot analysis comparing ubiquitylated proteins enriched from DSB- versus undamaged DNA-treated samples. Purple and blue dots indicate significantly enriched and -depleted ubiquitylated proteins. Significance was determined by two-tailed Student’s t-test, with permutation-based FDR-control with s0 = 0.1 and 2500 rounds of randomization, to ensure FDR ≤ 0.05. Source data are provided as a Source Data file.

