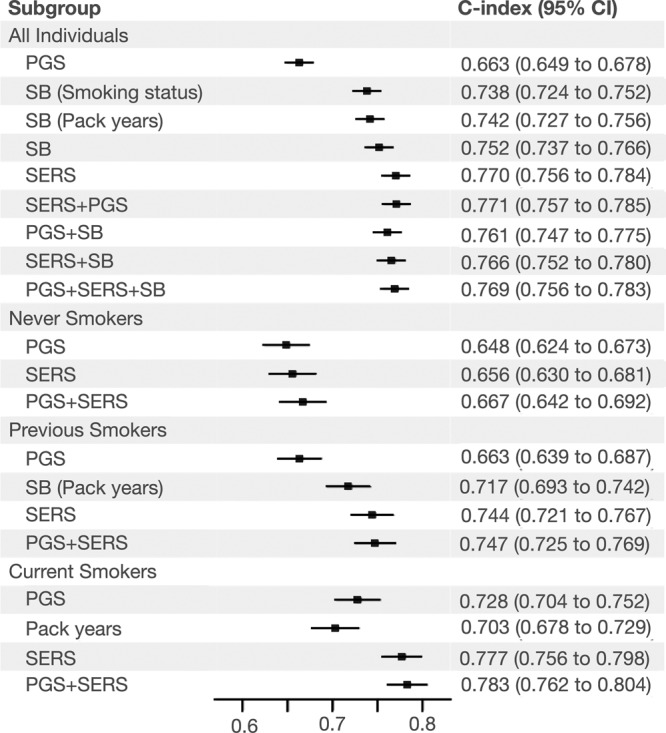
Fig. 3. Performance of each prediction model.

The C-indices and 95% confidence intervals for predicting COPD by various models in the entire EUR evaluation set individuals (N = 70,702) and across different smoking status subgroups (in never smokers N = 47,190, previous smokers N = 17,835, and current smokers N = 5675). All models include baseline factors sex, age, age2, sex × age, and the first four principal components of genetic ancestry. Data are presented as mean values of the C-indices with 95% confidence intervals. SB smoking behaviors, SERS socioeconomic and environmental risk score, PGS polygenic risk score. Source data are provided as a Source Data file.
