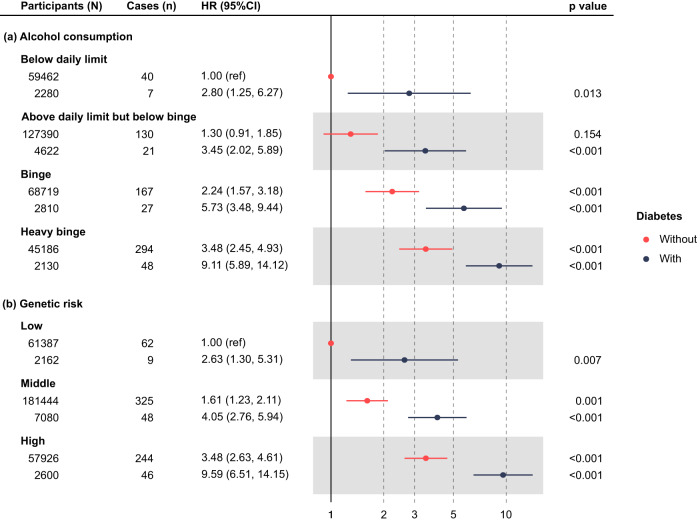
Fig. 3. Risk of alcohol-related cirrhosis by diabetes status and both alcohol consumption and polygenic risk group.
Data are presented as hazard ratios (HRs) with respective 95% confidence intervals (CIs). All the p values were two-sided and calculated using the Wald test. HRs were derived from Cox models with the following covariates: sex, age, ethnicity, Townsend deprivation index at recruitment, physical activity, smoking, total weekly alcohol intake, beverage type, drinking with/without meal, BMI, genotyping array, first 10 ancestry principal components plus PRS group, the interaction of alcohol consumption group and diabetes for (a), and alcohol consumption group, interaction of PRS group and diabetes for (b). Data are presented as HR and 95% confidence interval.

