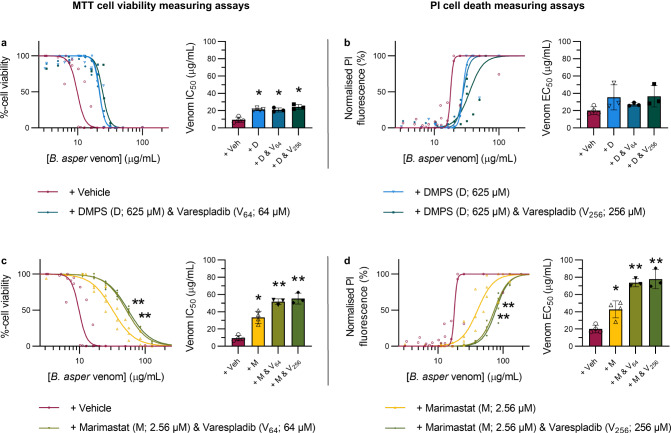
Fig. 4. Varespladib potentiates the inhibitory effects of marimastat, but not DMPS, against B. asper venom in HaCaT cells.
HaCaT cells were treated for 24 hours with serial dilutions of B. asper venom (2.2–190 µg/mL) that had been pre-incubated with drug vehicle control or with drug combination therapies consisting of DMPS (625 µM) plus varespladib (64 or 256 µM, abbreviated V64 or V256, respectively; top row) or marimastat (2.56 µM) plus V64 or V256 (bottom row). For all treatment groups, MTT cell viability (LHS of figure) and PI cell death (RHS of figure) assays were performed. * Signifies the value is significantly different than that of the vehicle control and ** signifies the value is significantly different than that of the marimastat-alone treatment, as determined by a one-way ANOVA comparing all treatments to each other followed by Tukey’s multiple comparisons test (P < 0.05, n = 3 [a{D & V64, D & V256}, b{D, D & V64, D & V256}, c{M & V64, M & V256}, d{M & V64, M & V256}] or 4 [a{Veh, D}, b{Veh}, c{Veh, M}, d{Veh, M}] biologically independent cell experiments). ANOVA statistics for individual statistically analysed graphs are: a F(3,10) = 26.63, P = 0.000044; b F(3,9) = 2.382, P = 0.1371; c F(3,10) = 56.55, P = 0.0000014; d F(3,10) = 40.41, P = 0.0000067. Data are presented as mean values ± SD and the individual values for each trial are shown as points within each of the graphs. Source data are provided as a Source Data file.

