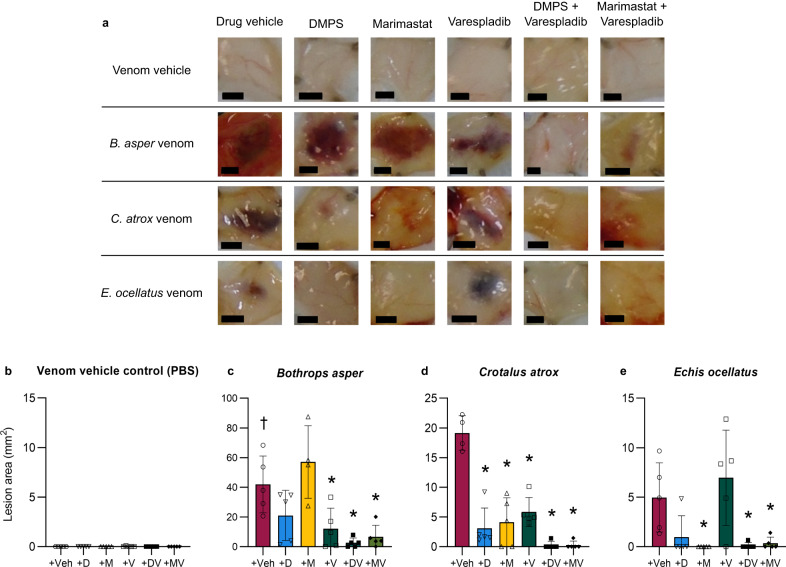
Fig. 5. Dermal lesions induced by distinct snake venoms are inhibited by drug combinations containing an SVMP and a PLA2 inhibitor.
Individual mice were ID injected with B. asper (150 µg), C. atrox (100 µg), or E. ocellatus (39 µg) venom or venom vehicle control (PBS) that had been pre-incubated with drug vehicle control (98.48% PBS, 1.52% DMSO; Veh), DMPS (110 µg; D), marimastat (60 µg; M), varespladib (19 µg; V), DMPS & varespladib (110 and 19 µg, respectively; DV), or marimastat & varespladib (60 and 19 µg, respectively; MV). After 72 hours† the mice were euthanised and their lesions excised, height and width measured with callipers, and photographed. a Representative images of the lesions resulting from each treatment group (black scale bar represents 3 mm). Bar graphs summarising the average total lesion areas for each drug treatment group when pre-incubated with b venom vehicle control (PBS), c B. asper, d C. atrox, or (e) E. ocellatus venom. † Signifies that these mice were culled at 24 h instead of the usual 72 h, due to their external lesions progressing to the maximum permitted size defined in our animal ethics licence, thus resulting in early euthanasia. * Signifies that value is significantly different than that of the drug vehicle control for that venom as determined by a one-way ANOVA followed by Dunnett’s multiple comparisons test (P < 0.05, n = 4 [c{M}, d{Veh}] or 5 [b{all}, c{Veh, D, V, DV, MV}, d{D, M, V, DV, MV}, e{all}] biologically independent animals). ANOVA statistics for individual statistically analysed graphs are: b F(5,24) = 1.000, P = 0.4389, c F(5,23) = 8.808, P = 0.000088; d F(5,23) = 28.80, P = 0.0000000035; e F(5,24) = 6.587, P = 0.0005. Data are presented as mean values ± SD and the individual values for each lesion are shown as points within each of the bars. Source data are provided as a Source Data file.

