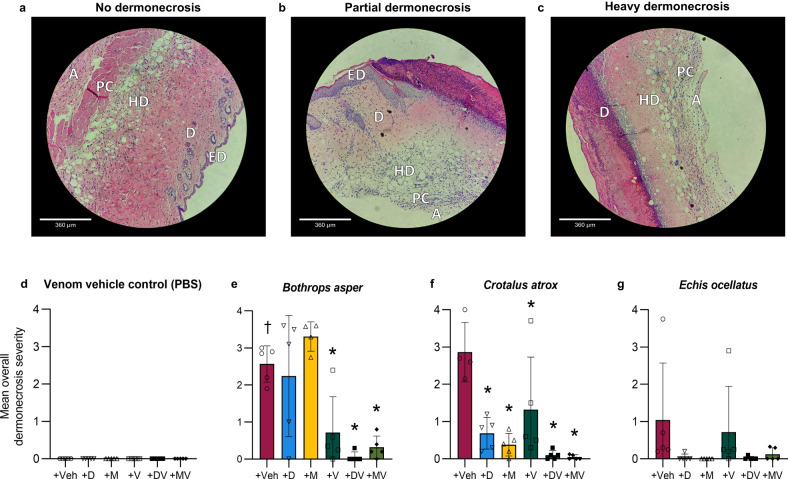
Fig. 6. Histopathological analysis of ID-injection site cross-sections confirms venom-induced dermonecrosis can be reduced using SVMP- and PLA2-inhibiting drugs.
Four µm H&E sections were prepared from formalin-fixed, paraffin-embedded tissue from dermal injection sites and photographed at 100X magnification. Two blinded and independent experimenters scored, between 0–4, the percentage of each skin layer that was necrotic (0 = 0%, 1 = 0–25%, 2 = 25–50%, 3 = 50–75%, and 4 = 75–100%). The highest recorded score per cross-section was used as a measure of the maximum severity reached within each skin sample. Representative 100X-magnified images showing a no dermonecrosis (mean overall dermonecrosis score of 0), b partial dermonecrosis (1.4) and c heavy dermonecrosis (2.4), with epidermis (ED), dermis (D), hypodermis (HD), panniculus carnosus (PC), and adventitia (A) annotated in each image (note that the ED is not visible in the ‘Heavy dermonecrosis’ image due to the severity of the ulceration, and was therefore given a necrosis score of 4). Bar graphs summarising the mean overall dermonecrosis severity scores in cross-sections from mice ID-injected with d venom vehicle control (PBS), e B. asper venom, f C. atrox venom, or g E. ocellatus venom that had been pre-incubated with drug vehicle control (98.48% PBS, 1.52% DMSO; Veh), DMPS (110 µg; D), marimastat (60 µg; M), varespladib (19 µg; V), DMPS-plus-varespladib (110 and 19 µg, respectively; DV), or marimastat-plus-varespladib (60 and 19 µg, respectively; MV). † Signifies these mice were culled at 24 h instead of the usual 72 h, due to their external lesions progressing to the maximum permitted size defined in the animal ethics licence, resulting in early euthanasia. * Signifies that value is significantly different than that of the drug vehicle control as determined by a one-way ANOVA followed by Dunnett’s multiple comparisons test (P < 0.05, n = 4 [e{M}, f{Veh}] or 5 [d{all}, e{Veh, D, V, DV, MV}, f{D, M, V, DV, MV}, g{all}] biologically independent animals). ANOVA statistics: e F(5,23) = 11.81, P = 0.0000097; f F(5, 23) = 10.30, P = 0.000028; g F(5,24)1.531, P = 0.2178. Data are presented as mean values ± SD and individual scores are shown as points within each of the figures’ bars. Source data are provided as a Source Data file.

