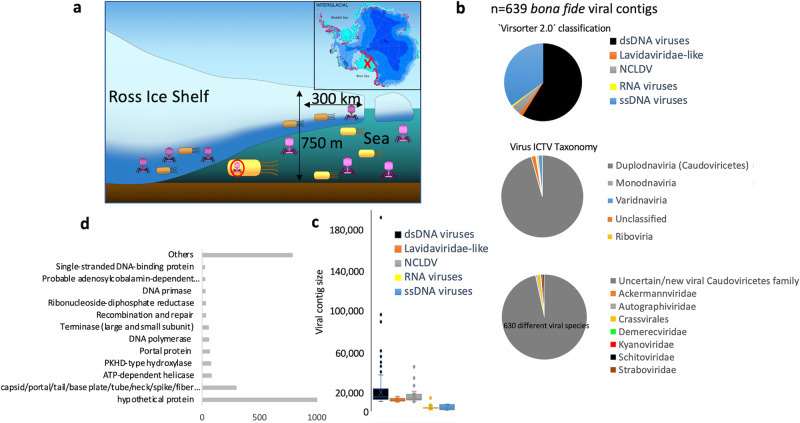
Fig. 1. General features of viruses beneath the Antarctic Ice Shelf.
a Schematic diagram showing the location of the Ross Ice Shelf (red “x” in map) and the structure of an ice shelf. Viral genomes recovered in this study were performed from single-amplified genomes, metagenome-assembled genomes, metatranscriptomes and metagenomes. b Classification of viruses according to International Committee of Viral Taxonomy (ICTV database) and program Virsorter 2.0. c Virus genome size (kb) according to type of virus. Box plot shows the genome size distribution of viral contigs putatively assigned by program Virsorter 2.0 to the following categories: dsDNA viruses (n = 376), Lavidaviridae (n = 9), nucleocytoplasmatic large DNA viruses (NCLDV; n = 26), RNA viruses (n = 4), and ssDNA viruses (n = 224). The median line and cross symbol represent the median and the mean, respectively. The box represents the first range between 1st and 3rd quartile. The bottom line of box is median of first quartile and upper line of box is median of the 3rd quartile. The whiskers represent the range of the data set (minimum and maximum value), excluding outliers (d) Gene annotation of RIS viruses. X axis depicts total number of annotated ORFs. For convenience, only most frequent categories are shown.

