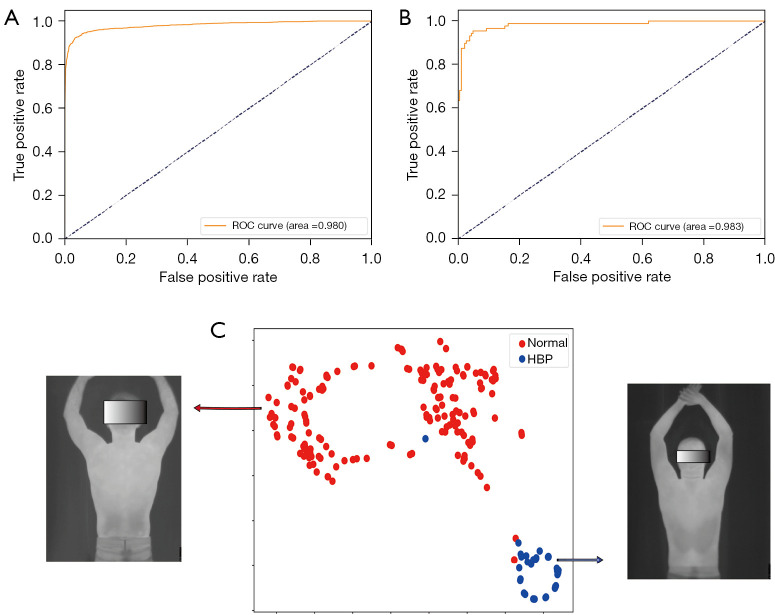
Figure 2.
Performance results of the model on the overall (upper body) imaging data and data visualization. (A) ROC curve of the model in the training set; (B) ROC curve of the model in the validation set; (C) data t-SNE visualization. ROC, receiver operator characteristic curve; HBP, high blood pressure; t-SNE, t-distribution stochastic neighbor embedding.

