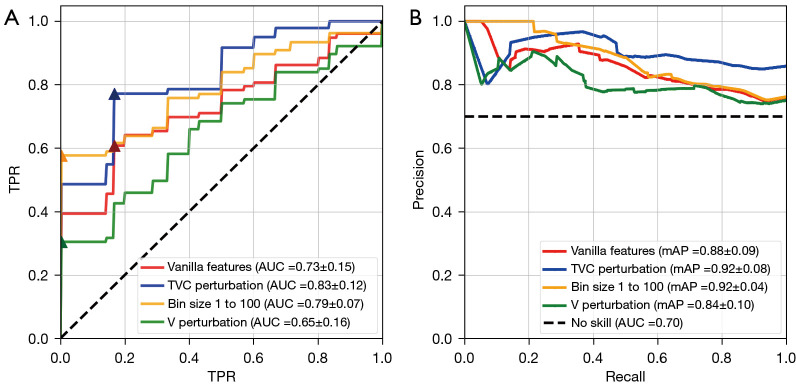
Figure 7.
Model performance plots for four discrete LDA models. (A) ROC curve plot highlighting model performance with the addition of feature flavour segmentations. TVC perturbations achieved the highest ROC AUC =0.83±0.12, SN: 77.9%, SP: 83.2% at optimal threshold (triangle marker). (B) Precision-recall curve to elucidate model performance for this class imbalanced dataset. Both plots indicate a strong boost to performance of the model by implementing TR feature methods. TPR, true positive rate; FPR, false positive rate; LDA, linear discriminant analysis; ROC, receiver operator characteristic; TVC, combination of image translation (T), segmentation volume adaptation (V) and contour randomization (C); mAP, mean average precision; AUC, area under the cure; SN, sensitivity; SP, specificity; TR, tensor radiomics.

