. 2023 Oct 11;29(24):5079–5086. doi: 10.1158/1078-0432.CCR-23-1807

Figure 3.

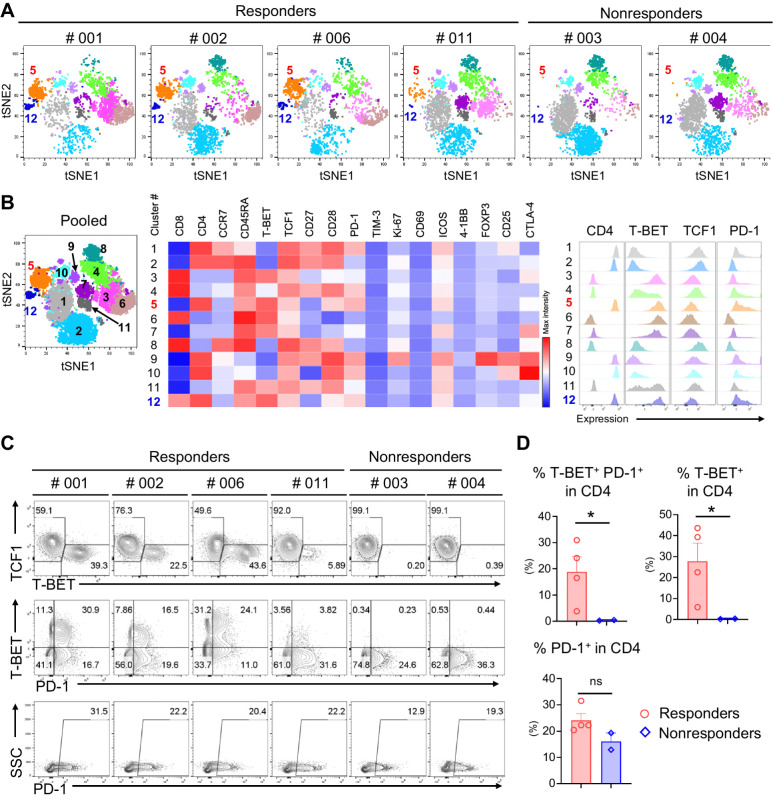
Figure 3. Immune profiling of PBMCs from patients at the baseline. t-SNE plots based on the multicolor FCM analysis of PBMCs at the baseline showing distinctly isolated 12 clusters (A and B). Cluster #5 (CD4+ T-BET+ TCF1− PD-1+ as shown in the mid heat map and the right histograms of B) and Cluster #12 (CD4+ T-BET+ TCF1− PD-1++) were highly enriched among the responders. Flow plots showed enriched T-BET+ or T-BET+ PD-1+ cells among responders and complete lack of these populations among nonresponders (C and D, top). PD-1 expression alone did not predict the responses (C and D, bottom). *, P < 0.05; ns, not significant.

Immune profiling of PBMCs from patients at the baseline. t-SNE plots based on the multicolor FCM analysis of PBMCs at the baseline showing distinctly isolated 12 clusters (A and B). Cluster #5 (CD4+ T-BET+ TCF1 PD-1+ as shown in the mid heat map and the right histograms of B) and Cluster #12 (CD4+ T-BET+ TCF1 PD-1++) were highly enriched among the responders. Flow plots showed enriched T-BET+ or T-BET+ PD-1+ cells among responders and complete lack of these populations among nonresponders (C and D, top). PD-1 expression alone did not predict the responses (C and D, bottom). *, P < 0.05; ns, not significant.