. 2023 Sep 28;83(24):4030–4046. doi: 10.1158/0008-5472.CAN-23-1065

Figure 2.

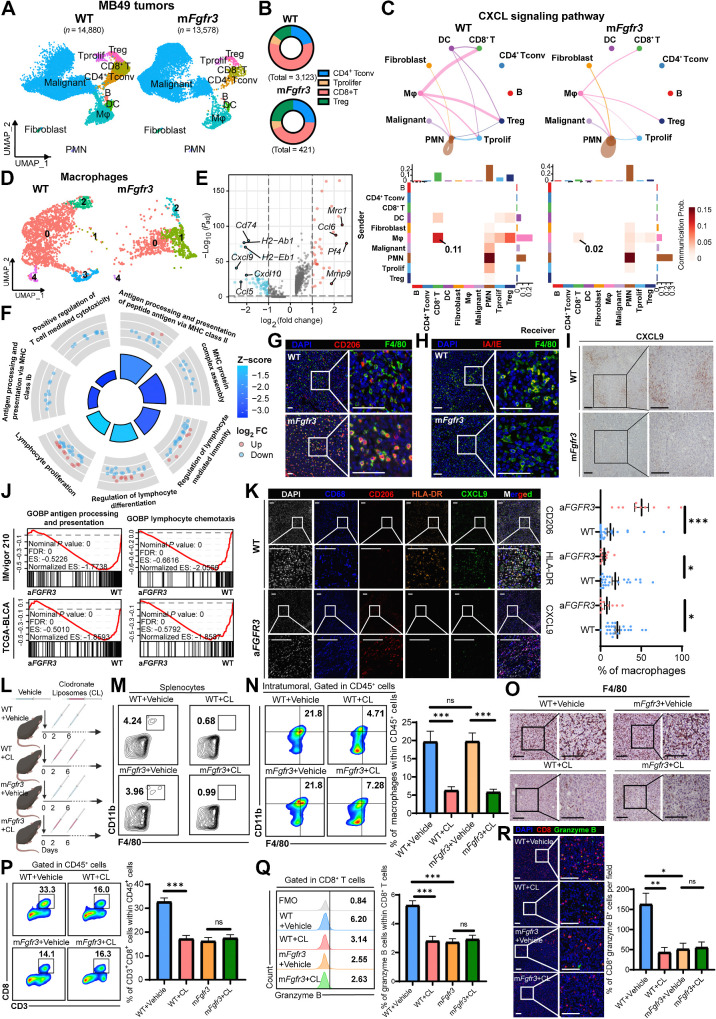
Figure 2. scRNA-seq highlights the central role of macrophages in inducing the cold TME of the mFgfr3 tumor. A, Uniform Manifold Approximation and Projection (UMAP) plot of scRNA-seq results of WT and mFgfr3 MB49 mice tumors colored by major cell types, 14,880 cells in the WT group and 13,578 cells in the mFgfr3 group. B, Pie chart shows the proportion of subtypes of T lymphocytes in the indicated groups. C, Circle plots and heatmap of CellChat analysis show the networks of the CXCL signaling pathway. D, UMAP plot of single cells of macrophages colored by subclusters. E, Volcano plot displays the differential genes of the subcluster-1 macrophages. F, GO analysis represents the enriched pathways in the subcluster-1 macrophages. G and H, Representative IF images showing the infiltration of CD206+ F4/80+ cells (G) and IA/IE+ F4/80+ cells (H) in the indicated groups. I, Representative IHC images showing the expression of CXCL9 in the indicated groups. J, GSEA showing the enrichment of antigen processing and presenting pathway and lymphocyte chemotaxis pathway in the IMvigor210 and TCGA-BLCA datasets. K, Representative multiplex IF images and statistical analysis showing the proportion of CD206+, HLA-DR+, and CXCL9+ cells within CD68+ macrophages in the SYSMH cohort; n = 24 in the WT group, n = 10 in the aFGFR3 group. L, Schematic illustration of macrophages depletion strategy with clodronate liposomes in MB49 tumor–bering mice. M, Flow cytometry analysis illustrating the proportion of macrophages in the splenocytes in the indicated groups. N and O, Flow cytometry analysis and IHC staining illustrating the proportion of macrophages in tumors in the indicated groups. P and Q, Flow cytometry analysis illustrating the proportion of CD3+CD8+ cells within CD45+ cells (P) and the proportion of granzyme B+ cells within CD8+ T cells (Q) in the indicated groups. R, Representative IF images and statistical analysis show CD8+ granzyme B+ cell infiltration in the indicated groups. The data are shown as the mean ± SEM values (n = 5 per group). P < 0.05 was considered a significant difference; ns, no significance (unpaired parametric Student t test). *, P < 0.05; **, P < 0.01; ***, P < 0.001. Scale bar, 100 μm. FMO, fluorescence minus one; Mφ, macrophages. SN, supernatants. (L, Created with BioRender.com.)

scRNA-seq highlights the central role of macrophages in inducing the cold TME of the mFgfr3 tumor. A, Uniform Manifold Approximation and Projection (UMAP) plot of scRNA-seq results of WT and mFgfr3 MB49 mice tumors colored by major cell types, 14,880 cells in the WT group and 13,578 cells in the mFgfr3 group. B, Pie chart shows the proportion of subtypes of T lymphocytes in the indicated groups. C, Circle plots and heatmap of CellChat analysis show the networks of the CXCL signaling pathway. D, UMAP plot of single cells of macrophages colored by subclusters. E, Volcano plot displays the differential genes of the subcluster-1 macrophages. F, GO analysis represents the enriched pathways in the subcluster-1 macrophages. G and H, Representative IF images showing the infiltration of CD206+ F4/80+ cells (G) and IA/IE+ F4/80+ cells (H) in the indicated groups. I, Representative IHC images showing the expression of CXCL9 in the indicated groups. J, GSEA showing the enrichment of antigen processing and presenting pathway and lymphocyte chemotaxis pathway in the IMvigor210 and TCGA-BLCA datasets. K, Representative multiplex IF images and statistical analysis showing the proportion of CD206+, HLA-DR+, and CXCL9+ cells within CD68+ macrophages in the SYSMH cohort; n = 24 in the WT group, n = 10 in the aFGFR3 group. L, Schematic illustration of macrophages depletion strategy with clodronate liposomes in MB49 tumor–bering mice. M, Flow cytometry analysis illustrating the proportion of macrophages in the splenocytes in the indicated groups. N and O, Flow cytometry analysis and IHC staining illustrating the proportion of macrophages in tumors in the indicated groups. P and Q, Flow cytometry analysis illustrating the proportion of CD3+CD8+ cells within CD45+ cells (P) and the proportion of granzyme B+ cells within CD8+ T cells (Q) in the indicated groups. R, Representative IF images and statistical analysis show CD8+ granzyme B+ cell infiltration in the indicated groups. The data are shown as the mean ± SEM values (n = 5 per group). P < 0.05 was considered a significant difference; ns, no significance (unpaired parametric Student t test). *, P < 0.05; **, P < 0.01; ***, P < 0.001. Scale bar, 100 μm. FMO, fluorescence minus one; Mφ, macrophages. SN, supernatants. (L, Created with BioRender.com.)