. 2023 Sep 28;83(24):4030–4046. doi: 10.1158/0008-5472.CAN-23-1065

Figure 3.

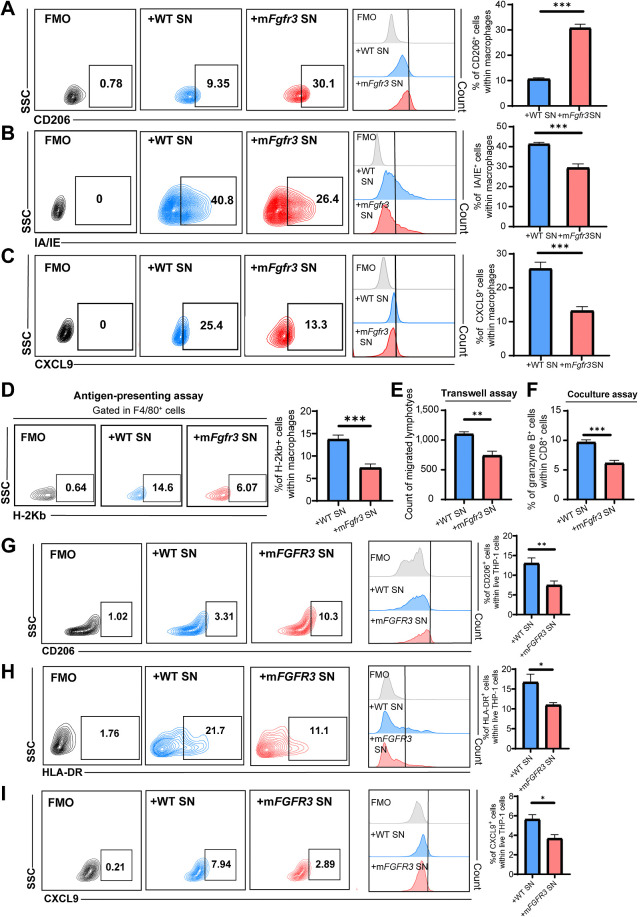
Figure 3. mFGFR3 cancer cells promote macrophage shift to an immune-inert phenotype. A–C, Flow cytometry analysis and statistical analysis illustrating the proportion of CD206+ cells (A), IA/IE+ cells (B), and CXCL9+ cells (C) within live BMDMs in the indicated groups. D, Antigen-presenting assays show the MHC-I SIINFEKL+ cells within the BMDMs. E, Transwell assay of lymphocytes with BMDMs previously stimulated by cancer cell supernatants shows the cell count of migrated lymphocytes in the indicated groups. F, Flow cytometry analysis of in vitro coculture of BMDMs previously stimulated with cancer cell supernatants with lymphocytes illustrating the proportion of granzyme B+ cells within CD8+ T cells in the indicated groups. G–I, Flow cytometry analysis and statistical analysis illustrating the proportion of CD206+ cells (G), HLA-DR+ cells (H), and CXCL9+ cells (I) within live THP-1 cells in the indicated groups. The data are shown as the mean ± SEM values (n = 6 per group). P < 0.05 was considered a significant difference (unpaired parametric Student t test). *, P < 0.05; **, P < 0.01; ***, P < 0.001. FMO, fluorescence minus one; SN, supernatants.

mFGFR3 cancer cells promote macrophage shift to an immune-inert phenotype. A–C, Flow cytometry analysis and statistical analysis illustrating the proportion of CD206+ cells (A), IA/IE+ cells (B), and CXCL9+ cells (C) within live BMDMs in the indicated groups. D, Antigen-presenting assays show the MHC-I SIINFEKL+ cells within the BMDMs. E, Transwell assay of lymphocytes with BMDMs previously stimulated by cancer cell supernatants shows the cell count of migrated lymphocytes in the indicated groups. F, Flow cytometry analysis of in vitro coculture of BMDMs previously stimulated with cancer cell supernatants with lymphocytes illustrating the proportion of granzyme B+ cells within CD8+ T cells in the indicated groups. G–I, Flow cytometry analysis and statistical analysis illustrating the proportion of CD206+ cells (G), HLA-DR+ cells (H), and CXCL9+ cells (I) within live THP-1 cells in the indicated groups. The data are shown as the mean ± SEM values (n = 6 per group). P < 0.05 was considered a significant difference (unpaired parametric Student t test). *, P < 0.05; **, P < 0.01; ***, P < 0.001. FMO, fluorescence minus one; SN, supernatants.