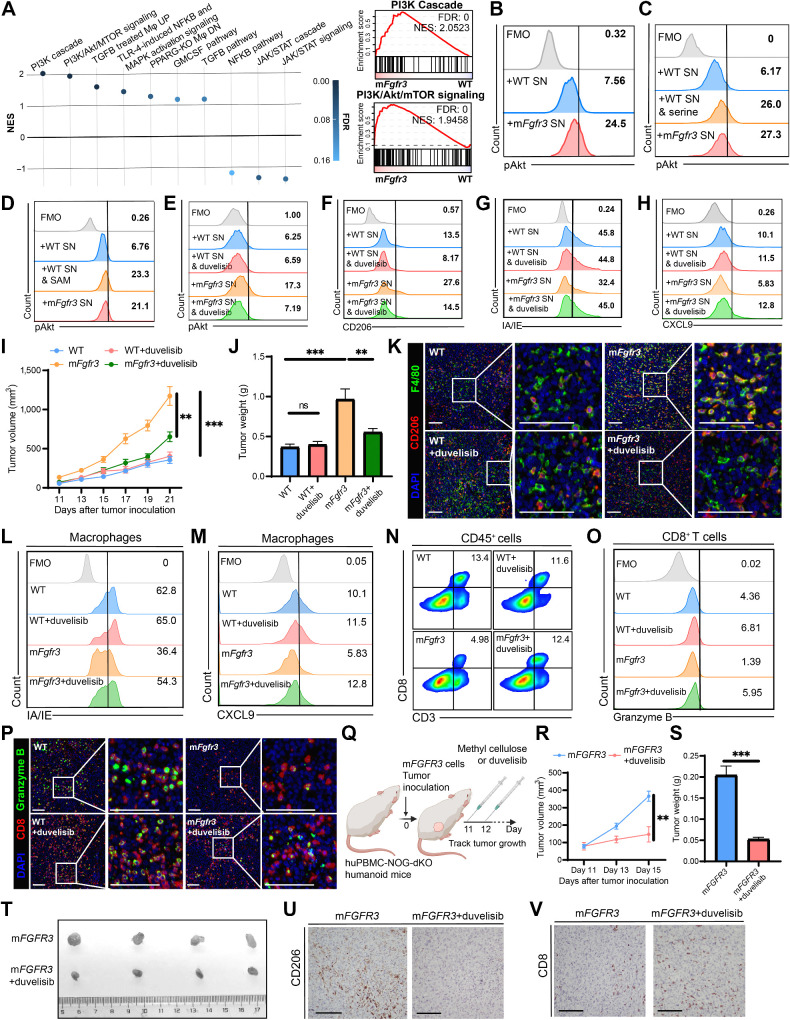
Figure 5.
Targeting the PI3K/Akt pathway in macrophages reverses macrophage phenotype in mFGFR3 cancers. A, Bubble chart of GSEA results involving the major pathways regulating macrophage phenotype in the macrophages cells from mFgfr3 cancers compared with the ones from WT cancers, along with enrichment results of the PI3K cascade pathway as well as PI3K/Akt/mTOR signaling pathway, Mφ, macrophages. B–D, Flow cytometry analysis illustrating the proportion of pAKT+ cells within BMDMs in the indicated groups. E–H, Flow cytometry analysis illustrating the proportion of pAKT+ cells (E), CD206+ cells (F), IA/IE+ cells (G), and CXCL9+ cells (H) within BMDMs in the indicated groups. I and J, Tumor growth curves (I) and tumor weights (J) of the indicated groups in the duvelisib monotherapy experiments. K, Representative images show the infiltration of CD206+ F4/80+ cells in the indicated groups. L and M, Flow cytometry analysis illustrating the proportion of IA/IE+ cells (L) and CXCL9+ cells (M) within macrophages in the indicated groups. N and O, Flow cytometry analysis illustrating the proportion of CD3+CD8+ cells within CD45+ cells (N) and the proportion of granzyme B+ cells within CD8+ T cells (O) in the indicated groups. P, Representative images show CD8+ granzyme B+ cell infiltration in the indicated groups. Q, Schematic illustration of duvelisib treatment strategy in huPBMC-NOG-dKO humanoid mice bearing mFGFR3 T24 tumors. R–T, Tumor growth curves (R), tumor weights (S), and the resected tumor picture (T) of the indicated groups in the duvelisib treatment experiment on the humanoid mice. U and V, IHC staining indicates the CD206 (U) and CD8 (V) infiltration in the indicated groups from the humanoid mice experiment. The data are shown as the mean ± SEM values (n = 6 per group in B, C, and E–J; n = 4 per group in R and S; n = 3 per group in U and V; n = 4–6 per group in D; n = 5–6 per group in L–O; n = 3–4 per group in K and P). P < 0.05 was considered a significant difference; ns, no significance (one-way ANOVA with Holm-Sidak multiple comparison tests). **, P < 0.01; ***, P < 0.001. Scale bar, 100 μm. FMO, fluorescence minus one; SN, supernatants. (Q, Created with BioRender.com.)

