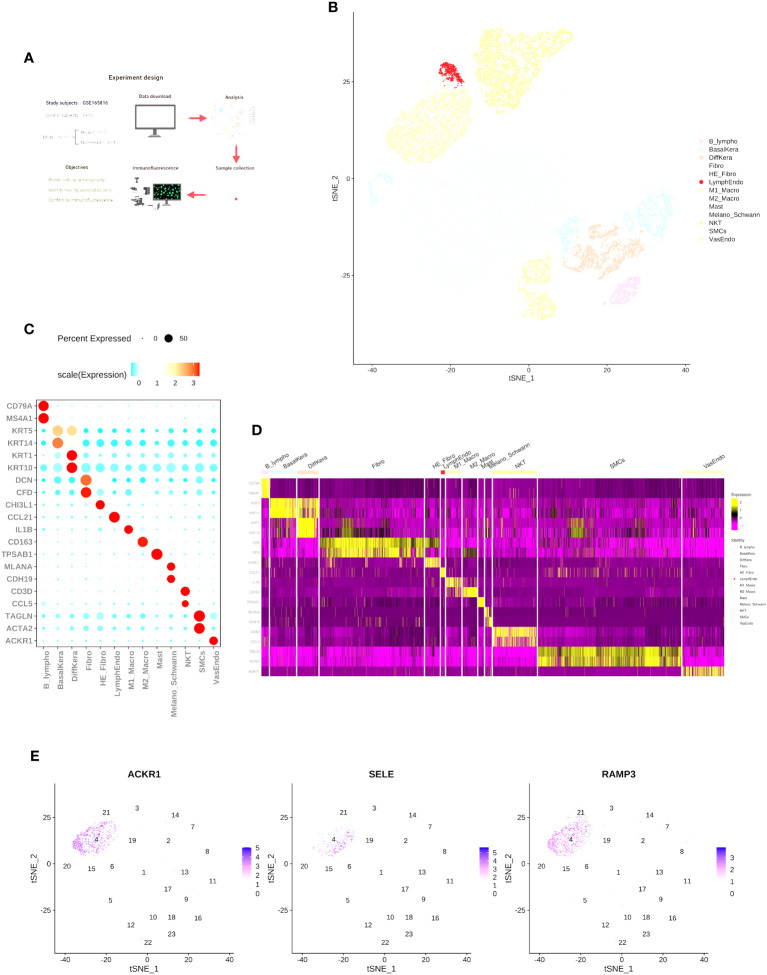
Figure 1.
Single-cell RNA-seq reveals heterogeneity in normal skin and diabetic foot ulcers. (A) Overview of the study design and the number of samples in each clinical group. (B) t-SNE plot showing the composition of the entire dataset consisting of 53,199 cells. Cells are color-coded by orthogonal-generated clusters and labeled based on manual cell type annotations (HE-Fibro, Healing-enriched fibroblasts; Fibro, Fibroblasts; SMCs, Smooth muscle cells; BasalKera, Basal keratinocytes; DiffKera, Differentiated keratinocytes; Melano/Schwann, Melanocytes and Schwann cells; Mast, Mast cells; VasEndo, Vascular endothelial cells; M1-macro, M1 macrophages; M2-macro, M2 macrophages; NKT, NK cells and T lymphocytes; LymphEndo, Lymphatic endothelial cells; B-lympho, B lymphocytes). (C) Dot plots displaying the expression of cell type-specific marker genes used for cell type annotation. The size of the dots represents the percentage of cells in each cell cluster expressing the marker gene, and the color represents the average proportion of expression levels (blue: low, red: high). (D) Heatmap showing the top highly expressed genes in each cell cluster. (E) Expression profiles of characteristic genes for vascular endothelial cells: (I) ACKR1, (II) SELE, and (III) RAMP3. The schematic diagram in (A) was created using BioRender (BioRender.com).

