Figure 2.
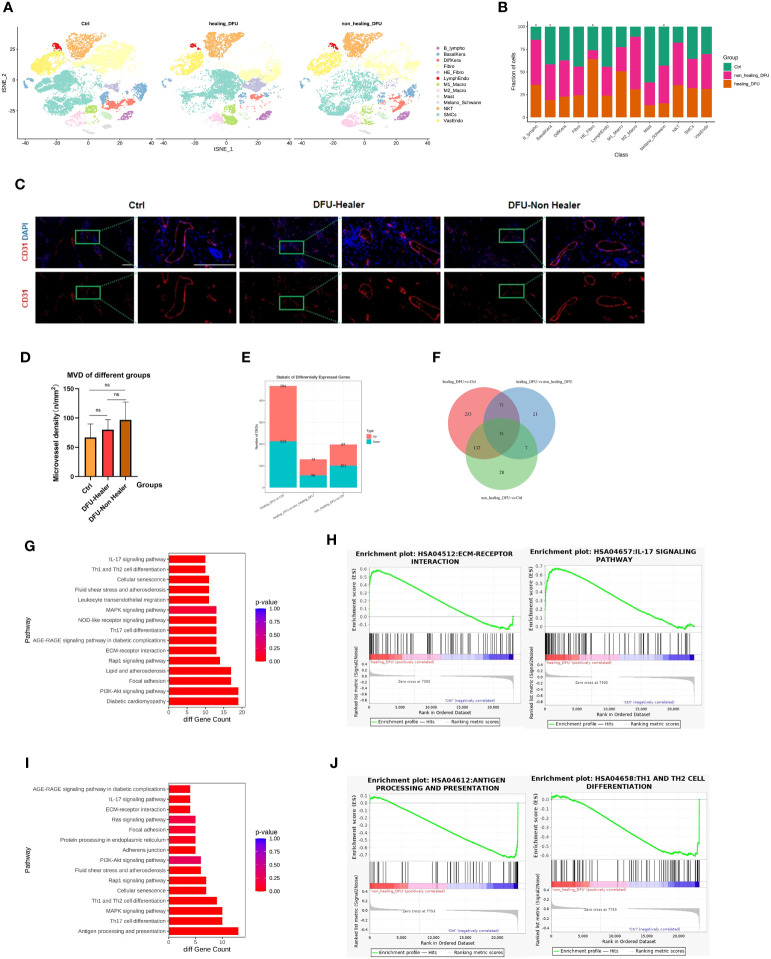
Single-cell transcriptomic analysis profiles comparing Healthy Control, DFU-Healer, and DFU-Non-Healer groups, describing gene features and healing-related biological pathways. (A) Separated t-SNE plot of the Healthy Control, DFU-Healer, and DFU-Non-Healer groups. Cell clusters were manually annotated based on the expression of specific markers, representing various known and novel cell types (as shown in Figures 1C, D ). (B) Stacked bar plots showing the proportions of different cell types in the three clinical groups. Green: Healthy Control, Orange: DFU-Healer, Red: DFU-Non-Healer. Cell types with significant differences among the clinical groups are marked with asterisks. (C) Immunofluorescence staining showing the distribution of blood vessels in the three groups (healers; n = 5, non-healers; n = 4, healthy controls; n=3). CD31: Red, DAPI: Blue. Scale bars are 200 μm. (D) Bar graph displaying the statistical analysis of blood vessel density in the three groups (healers; n = 5, non-healers; n = 4, healthy controls; n=3). * denotes significant differences (p<0.05), ns denotes no significant difference (one- way ANOVA with Fisher’s LSD post-hoc). (E) Bar plots comparing the number of differentially expressed genes in endothelial cells among the three clinical groups in pairwise fashion. (F) Venn diagram showing the number of commonly significant differentially expressed genes among the three clinical groups. (G) Immune and inflammation related KEGG pathways for significantly differentially expressed genes of vascular endothelial cells between DFU-Healer and Healthy Control. (H) The significantly enriched GESA plot(FDR<0.05) based on the KEGG pathways in (G). (I) Immune and inflammation related KEGG pathways for significantly differentially expressed genes of vascular endothelial cells between DFU-Non-Healer and Healthy Control. (J) The significantly enriched GESA plot(FDR<0.05) based on the KEGG pathways in (I).

