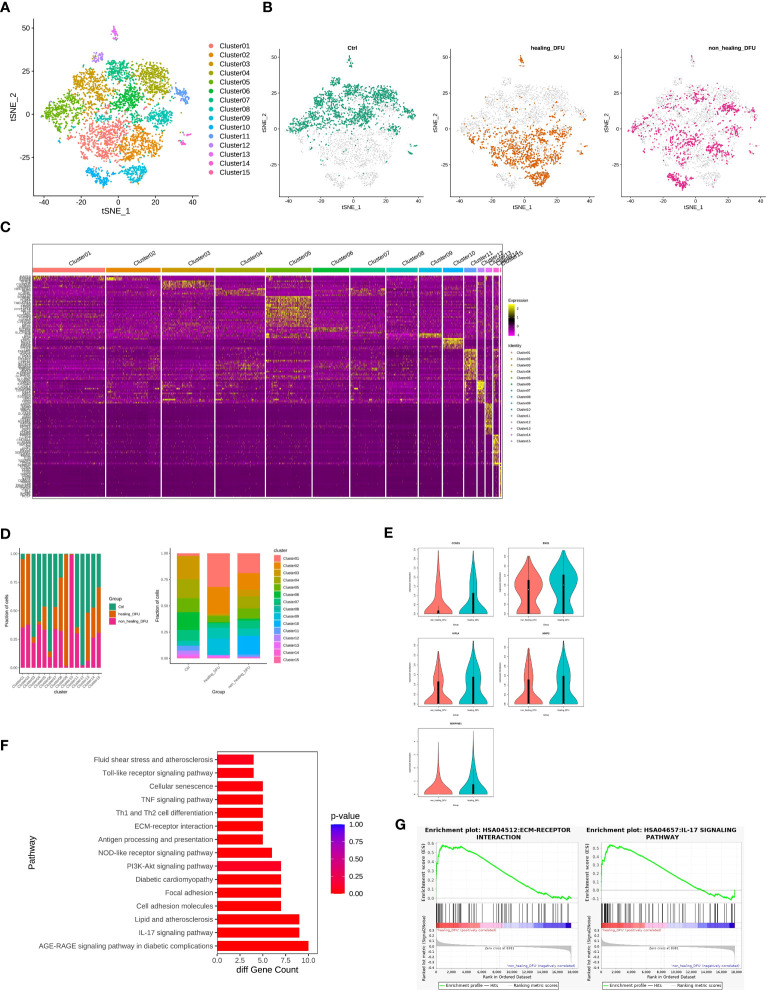
Figure 4.
Comparison of gene features and healing-related biological pathways in subpopulations of endothelial cells between DFU-Healer and DFU-Non-Healer groups. (A) t-SNE plot embedding of the entire dataset comprising 4948 cells. Cells are colored by orthogonal-generated clusters and labeled based on manual cell type annotations. (B) t-SNE plot showing the separation of subpopulations of endothelial cells from Healthy Control, DFU-Healer, and DFU-Non-Healer groups. (C) Heatmap displaying top highly expressed genes within each cell subpopulation. (D) Bar plot depicting the proportions of endothelial cell subpopulations. (E) Violin plot illustrating the differential expression of CCND1, ENO1, HIF1α, MMP2, and SERPINE1 between healing-related subpopulations 1, 2, and 5 (HE-VasEndo) in the DFU-Healer and DFU-Non-Healer groups. (F) KEGG pathway enrichment analysis of significantly differentially expressed genes in healing-related subpopulations 1, 2, and 5 (HE-VasEndo) of DFU-Healer and DFU-Non-Healer. (G) GSEA-KEGG showing significantly enriched pathways between DFU-Healer and DFU-Non-Healer.

