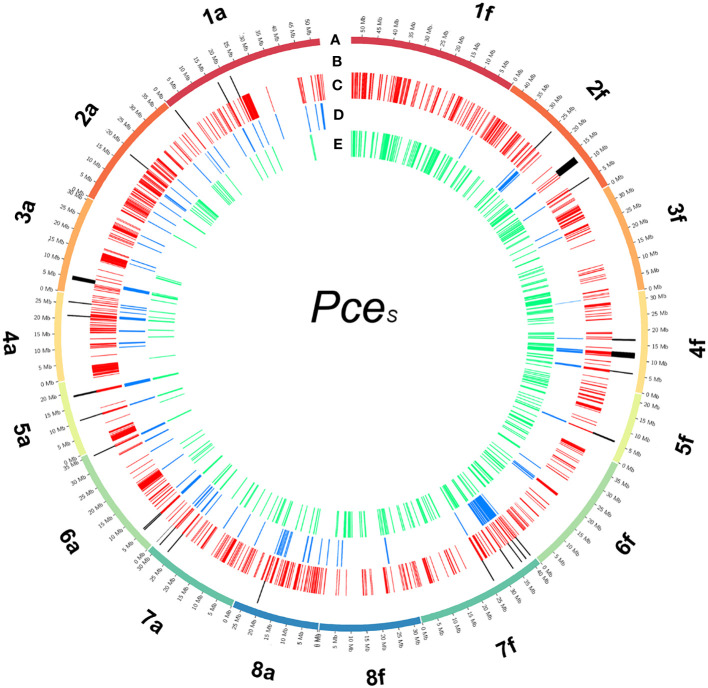
Figure 4.
Detected regions of homoeologous exchanges in the genome of P. cerasus ‘Schattenmorelle’. Circos plot of 16 pseudomolecules of the subgenomes of Pce S_a and Pce S_f. (A) Chromosome length (Mb); (B) 16 in PceS _a and 12 in Pce S_f detected regions that match all three following analysis methods: (C) 1,024 regions (100k window) were intraspecific %-covered bases from mapped reads (Pce S_a to Pa T, Pce S_f to Pf eH) was less than interspecific %-covered bases from mapped reads (Pce S_a to Pf eH, Pce S_f to Pa T); (D) 148 regions were intraspecific difference of %-covered bases from obtained RNAseq reads (Pa and Pce S_a, Pf and Pce S_f) greater than interspecific difference of %-covered bases from obtained RNAseq reads (Pf and Pce S_a, Pa and Pce S_f); (E) 367 regions were the proportion of transcripts with intraspecific amino acid identity (Pa T and Pce S_a, Pf eH and Pce S_f) less than the proportion of transcripts with interspecific amino acid identity (Pf eH and Pce S_a, Pa T and Pce S_f).

