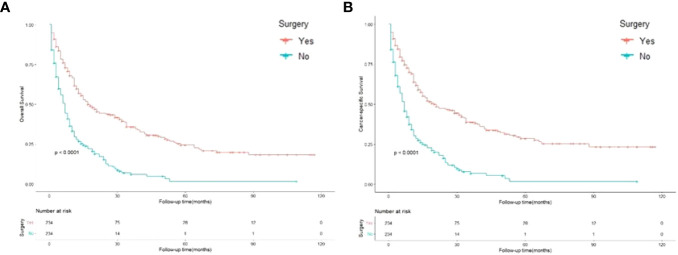
Figure 3.
Kaplan-Meier curves for overall and cancer-specific survival in patients with and without gastrectomy. Life tables for patients at risk are given below each plot. (A) Overall survival of patients with and without gastrectomy. (B) Cancer-specific survival of patients with and without gastrectomy.

