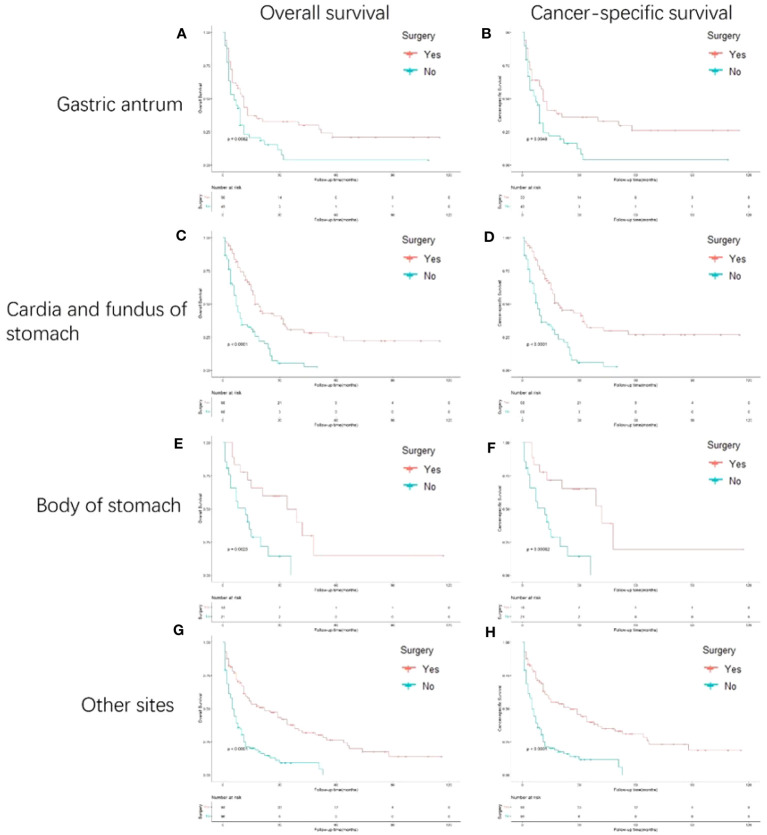
Figure 4.
Kaplan-Meier curves for overall and cancer-specific survival in patients with and without gastrectomy stratified based on primary site. Life tables for patients at risk are given below each plot. (A) OS of patients whose primary site is gastric antrum patients with and without gastrectomy. (B) CSS of patients whose primary site is gastric antrum patients with and without gastrectomy. (C) OS of patients whose primary site is cardia and fundus of stomach with and without gastrectomy. (D) CSS of patients whose primary site is cardia and fundus of stomach with and without gastrectomy. (E) OS of patients whose primary site is body of stomach of stomach with and without gastrectomy. (F) CSS of patients whose primary site is body of stomach of stomach with and without gastrectomy. (G) OS of patients whose primary site is other sites of stomach with and without gastrectomy. (H) CSS of patients whose primary site is other sites of stomach with and without gastrectomy.

