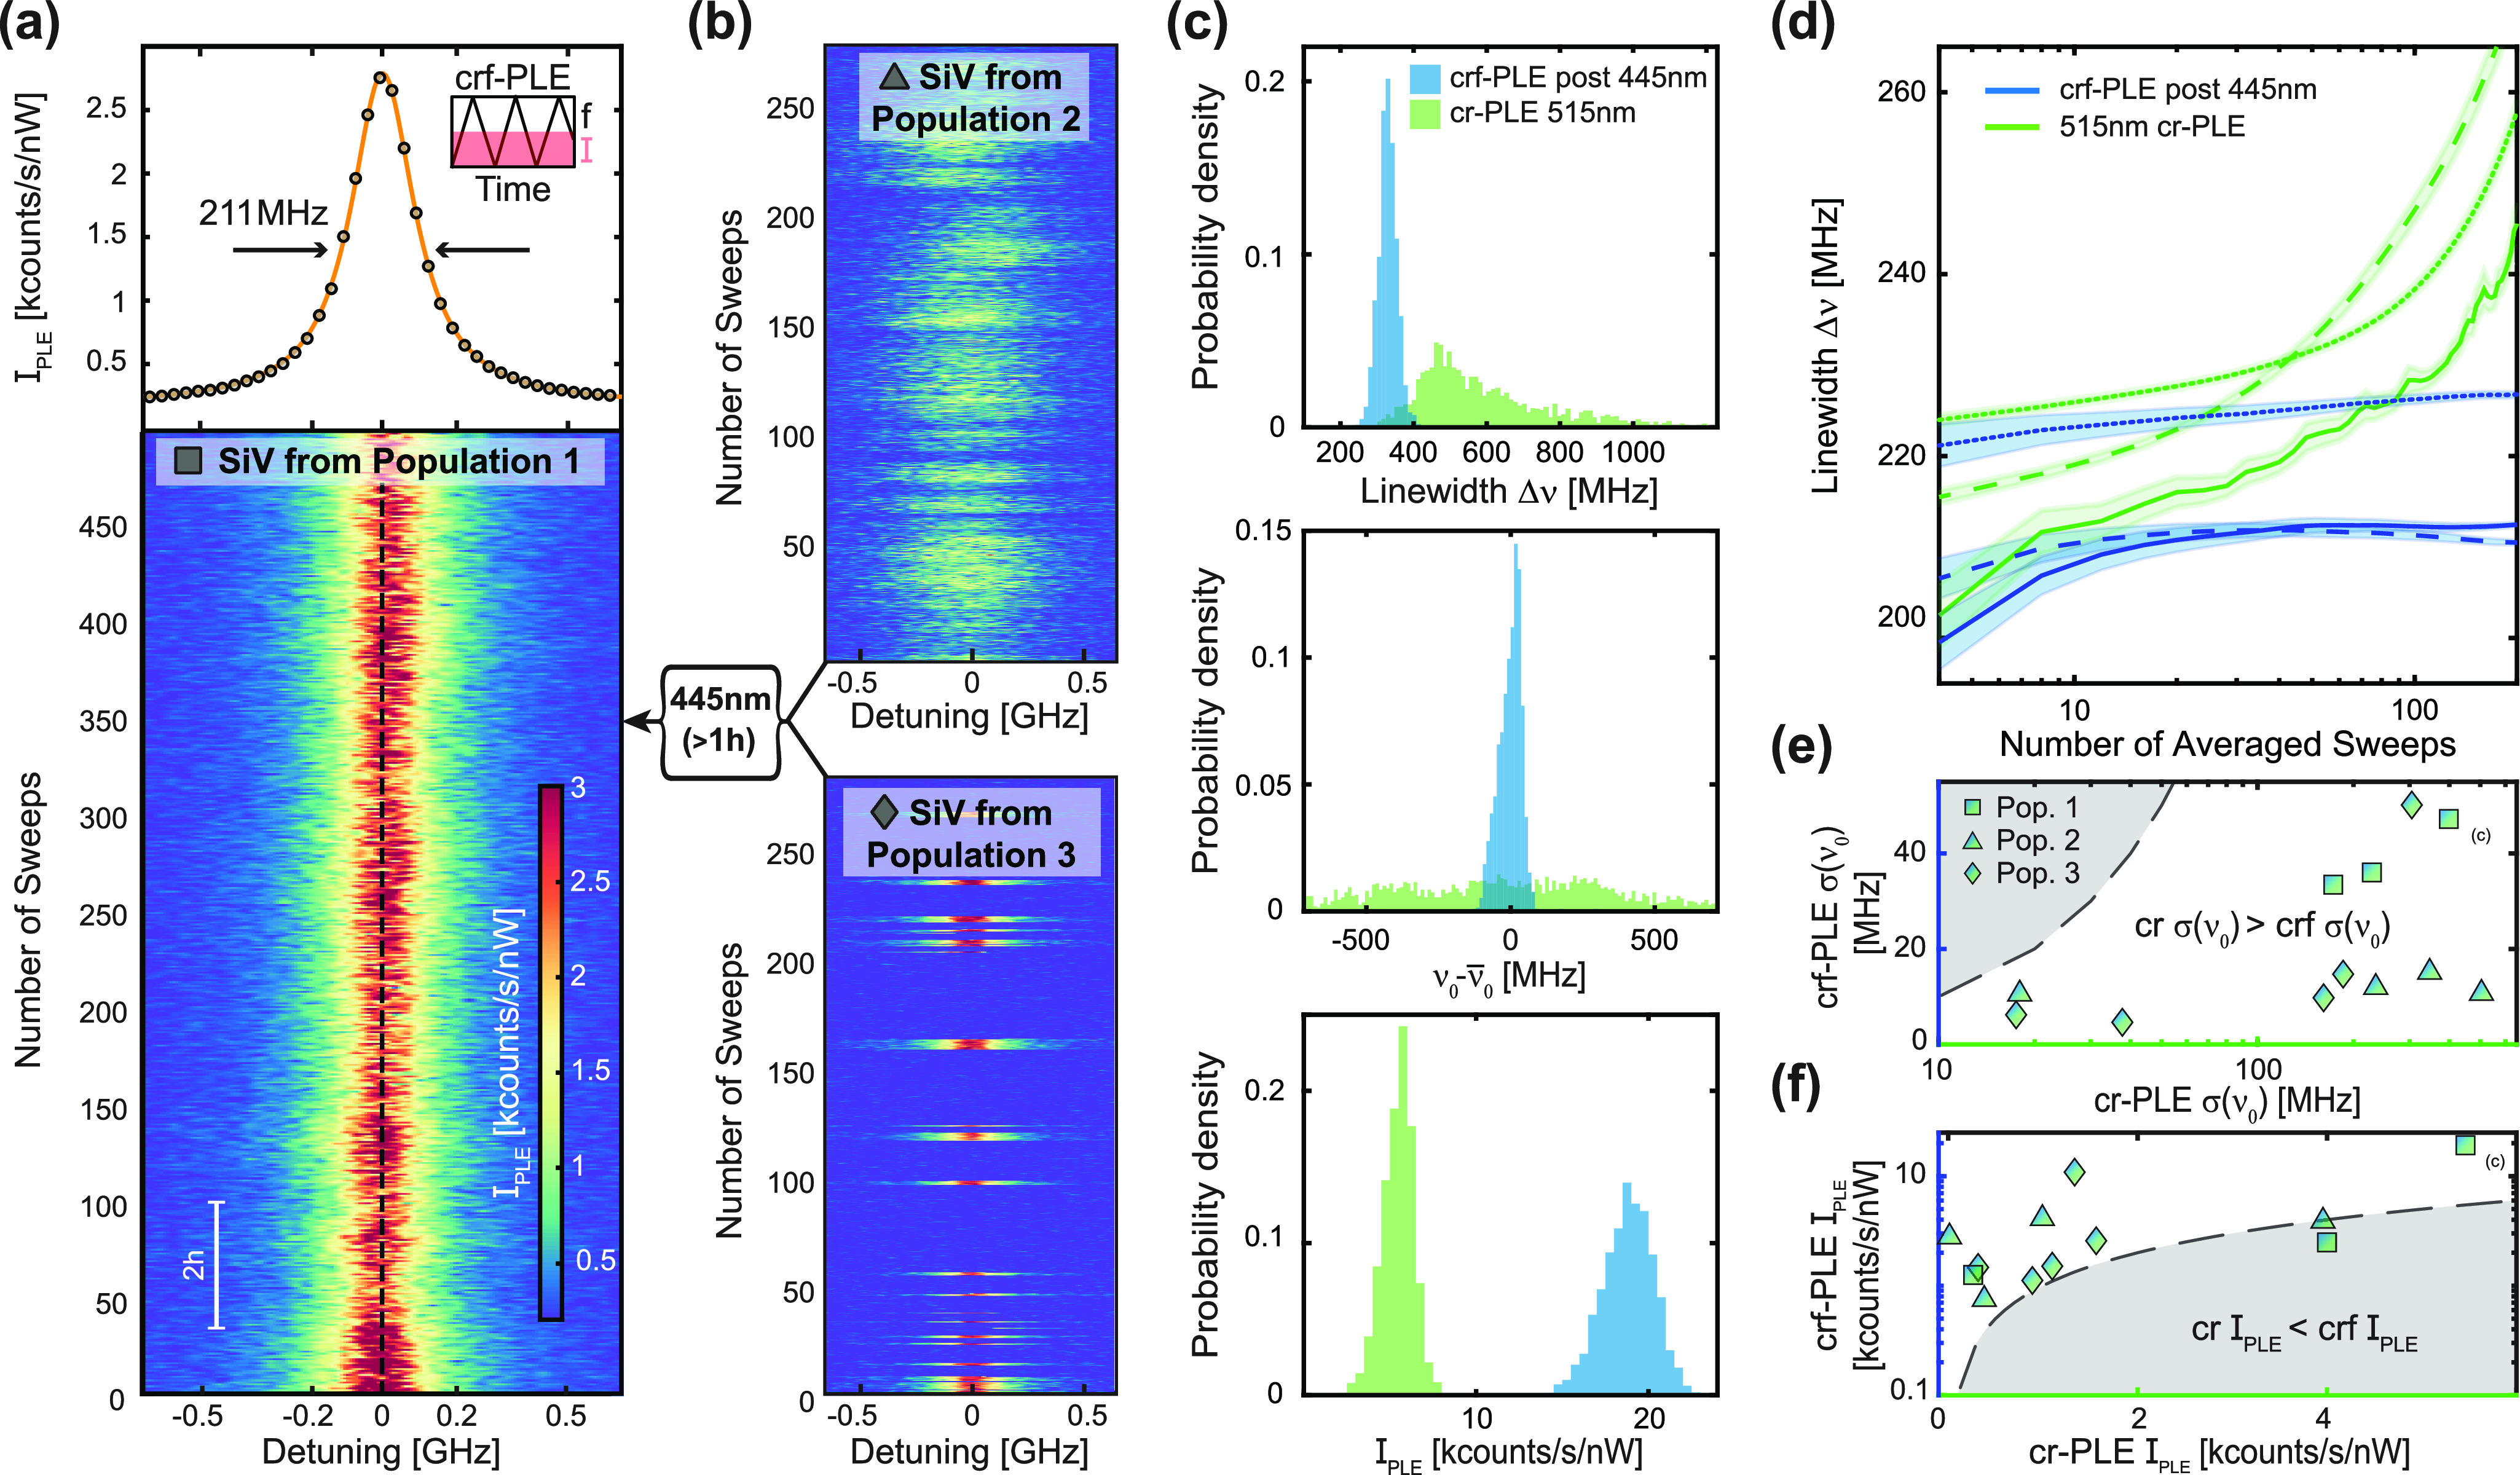
Figure 3.

Repump-free photoluminescence excitation (crf-PLE) of SiV– in diamond parabolic reflectors and charge-state stabilization with
445 nm laser light. (a) Top: crf-PLE measurement averaged over 500
single sweeps across the resonance while collecting (PSB) counts.
A Lorentzian fit (yellow) to the data reports an inhomogeneously broadened
linewidth of 211.5 ± 0.5 MHz, within a factor of 2.15 of the
lifetime limit (98.9 ± 0.9 MHz) for this particular emitter.
The inset illustrates how we conduct crf-PLE experiments with constant
laser intensity while modulating the laser frequency. Bottom: Trace
of the PLE measurement, showing 500 single sweeps. A dashed black
line acts as a guide to the eye for zero detuning. (b) Diagram illustrating
the additional populations of SiV–, classified by
their behavior in crf-PLE (see main text). Populations 2 and 3 can
be stabilized by applying high-powered (>5 mW) 445 nm laser light
for extended durations (>1 h). (c) Top panel: Histogram of single
sweep Lorentzian linewidths Δν of an SiV– initially in population 3, which was mapped to population 1. Green
bars are results from 515 nm charge-repump PLE (cr-PLE) and blue from
crf-PLE after the SiV– is exposed to the 445 nm
laser. This representative data set shows that 445 nm exposure decreases
single sweep linewidths compared to 515 nm cr-PLE. Middle panel: Center
frequency spread  extracted from the same PLE measurements,
revealing that line stability is dramatically improved in crf-PLE.
Bottom panel: Excitation power normalized peak intensity IPLE comparison for 515 nm cr-PLE and crf-PLE. (d) Lorentzian fitted
PLE linewidths Δν as a function of the number of sweeps
over which the PLE spectrum is averaged for three representative SiV–, comparing standard 515 nm cr-PLE (in green) and crf-PLE
after 445 nm (in blue) illumination, exemplifying the distinct behavior
between the measurement schemes. While crf-PLE converges to an average
linewidth, linewidths measured during cr-PLE diverge [c.f. SIFigure S8 for more
data sets]. Data sets corresponding to the same SiV– are drawn with the same linestyle. The shaded area signifies the
standard error. (e) Center frequency deviation σ(ν0) comparison between crf-PLE on the y-axis
and cr-PLE on the x-axis. The data point corresponding
to the histograms in (c) is marked. A dashed black line denotes y
= x. Markers denote the three populations introduced in (a) and (b).
(f) Comparison between 515 nm cr- and crf-PLE excitation power normalized
peak intensity for the three populations as in (e), with the dashed
black line denoting y = x.
