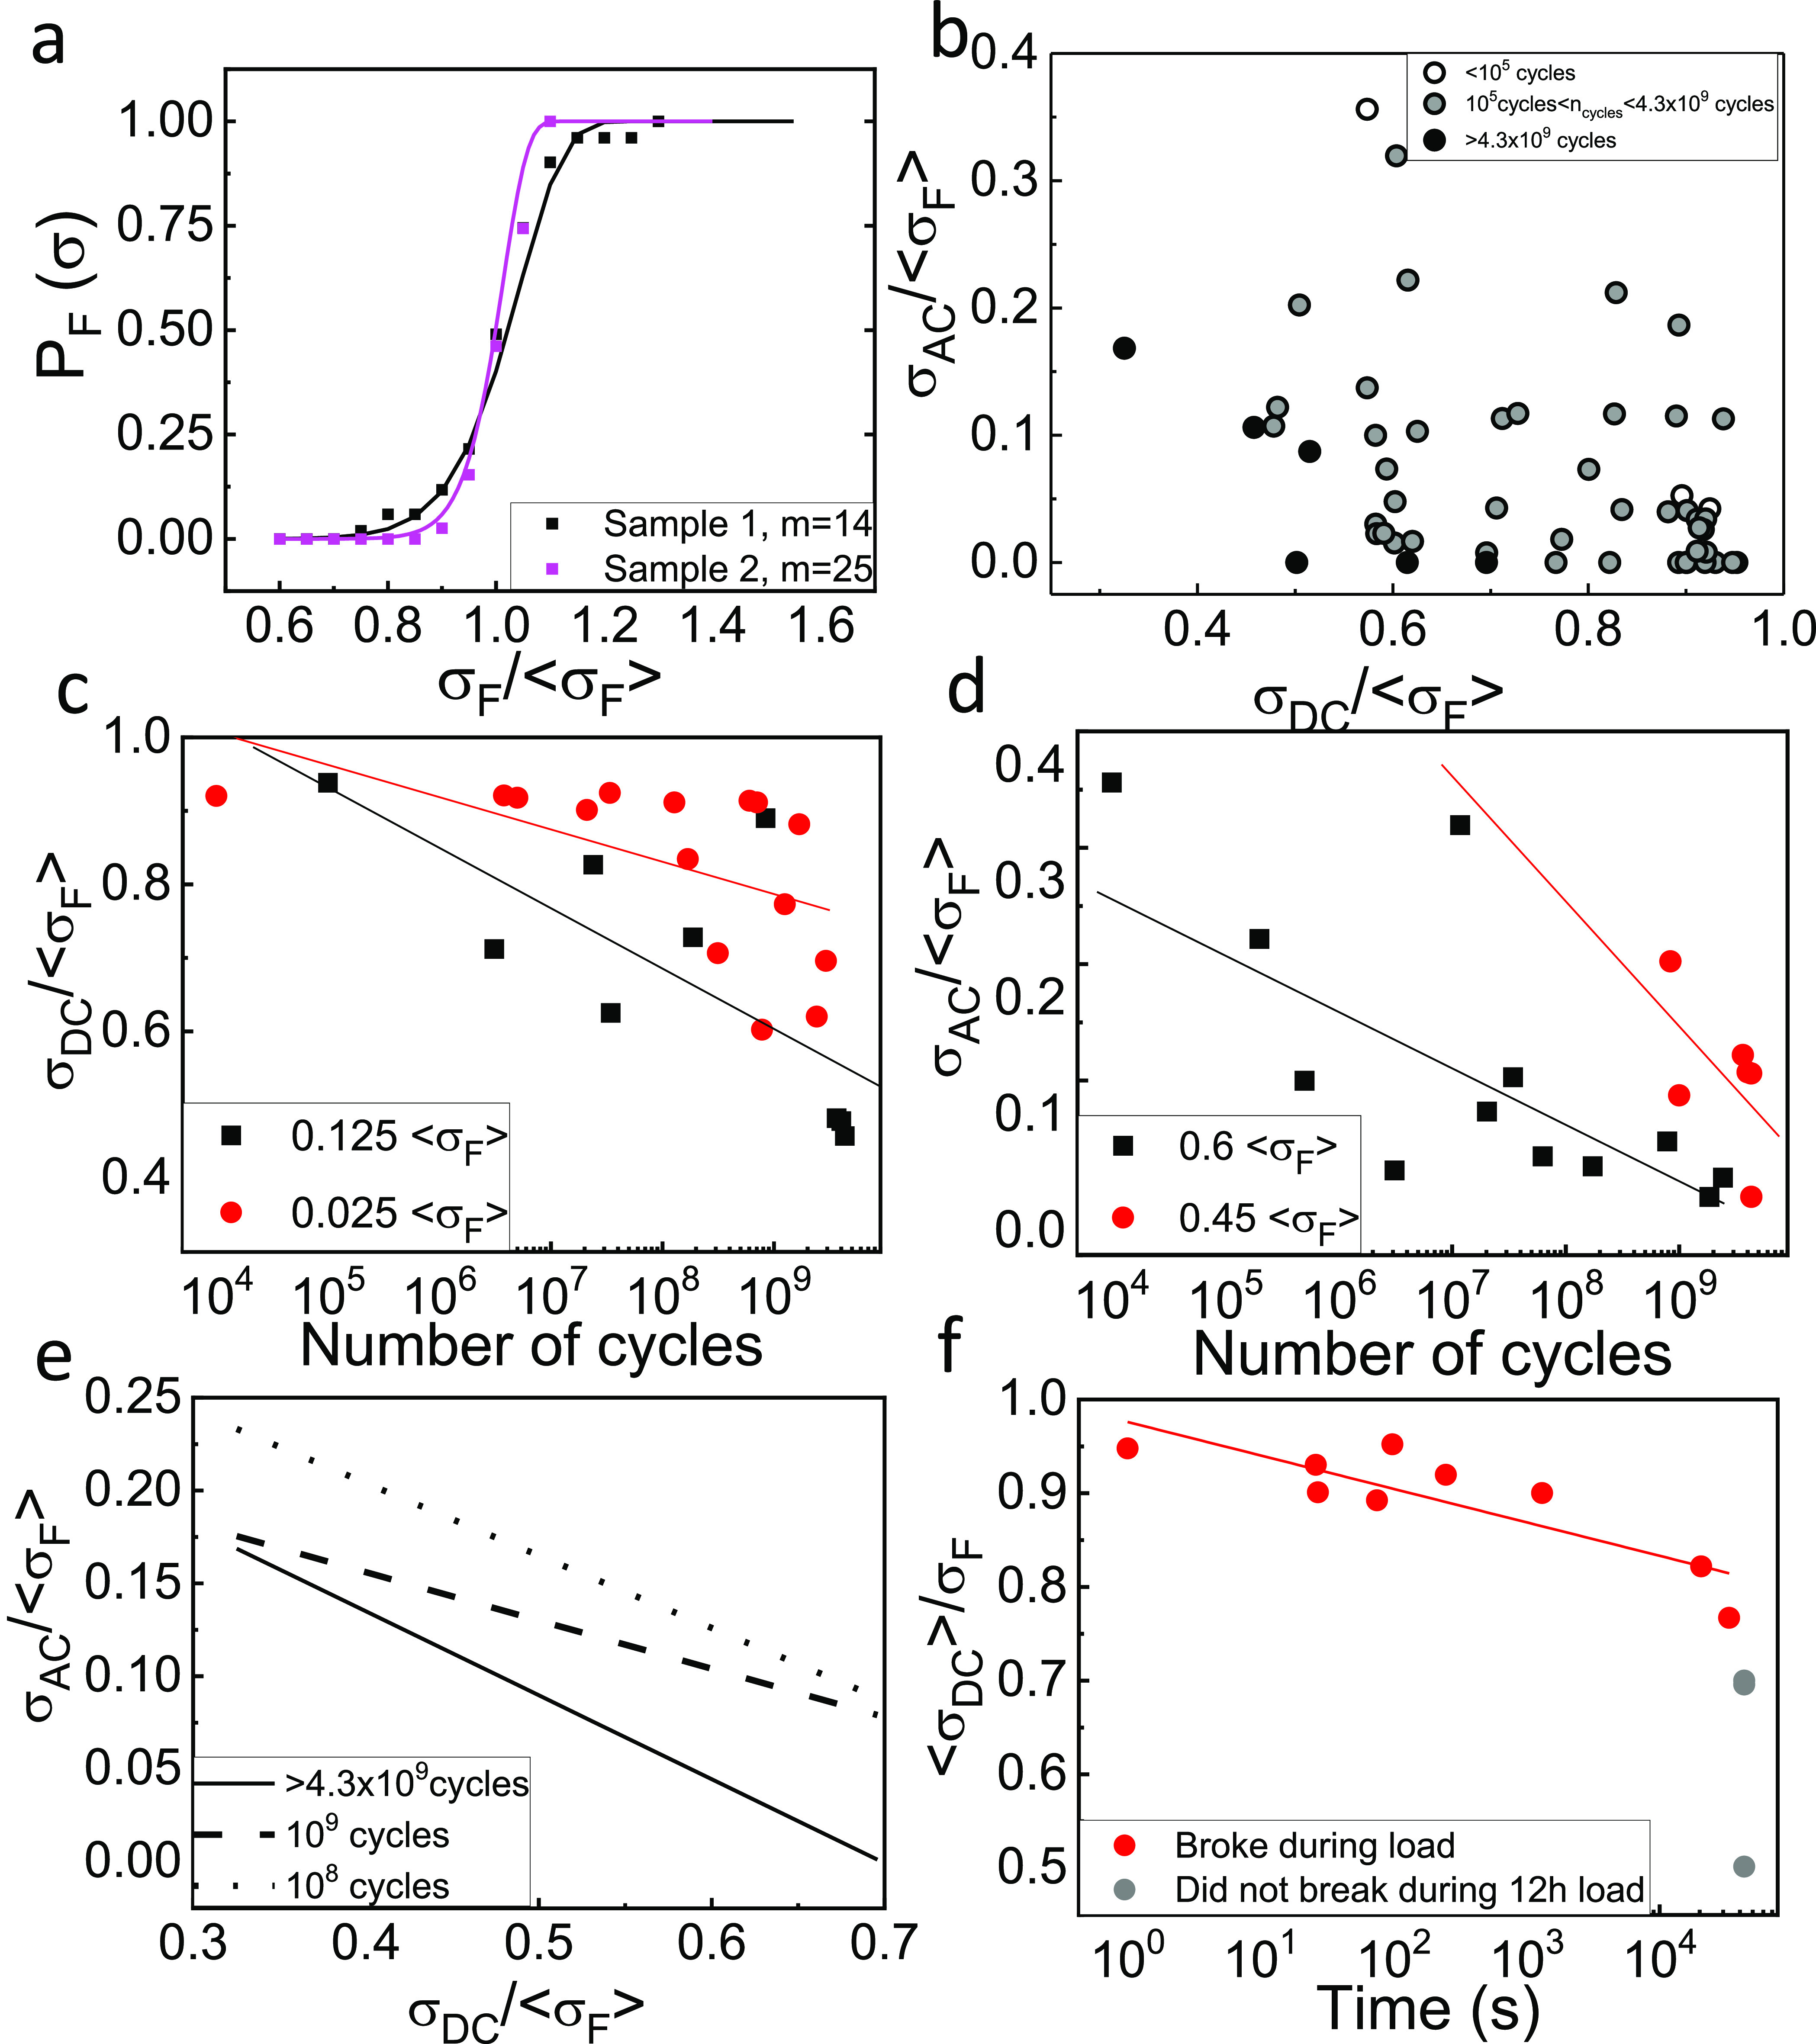
Figure 2.

(a) Probability plot of the surveillance of MoS2 drumheads at different stresses and corresponding Weibull fitting for the two batches of as-grown samples. (b) Goodman diagram representing the applied static (horizontal axis) and dynamic (vertical axis) stress, normalized to the mean breaking strength. Black circles correspond to drumheads that survived after 4.3 × 10⁹ cycles, gray circles represent those that fractured between 1 and 4.3 × 10⁹ cycles, and white dots represent those that broke just after reaching the DC load. (c) S–N diagram with varying σDC at two different σAC of 0.125⟨σF⟩ and 0.025⟨σF⟩. (d) S–N diagram of microdrums supporting σAC/σF of 0.6⟨σF⟩ and 0.45⟨σF⟩ with varying σAC. (e) Goodman lines for microdrums that did not fracture (solid line, lim = 0.45⟨σF⟩, c = 1.5), for 109 cycles (dashed line, lim = 0.26⟨σF⟩, c = 1) and 108 cycles (dotted line, lim = 0.36⟨σF⟩, c = 1.1). Note that, for nonbroken microdrums, we only provide an upper limit. (f) Static fatigue for as-grown MoS2. Red dots: microdrums that broke in times lower than 12 h. Gray dots: microdrums that did not break after 12 h of static loading.
