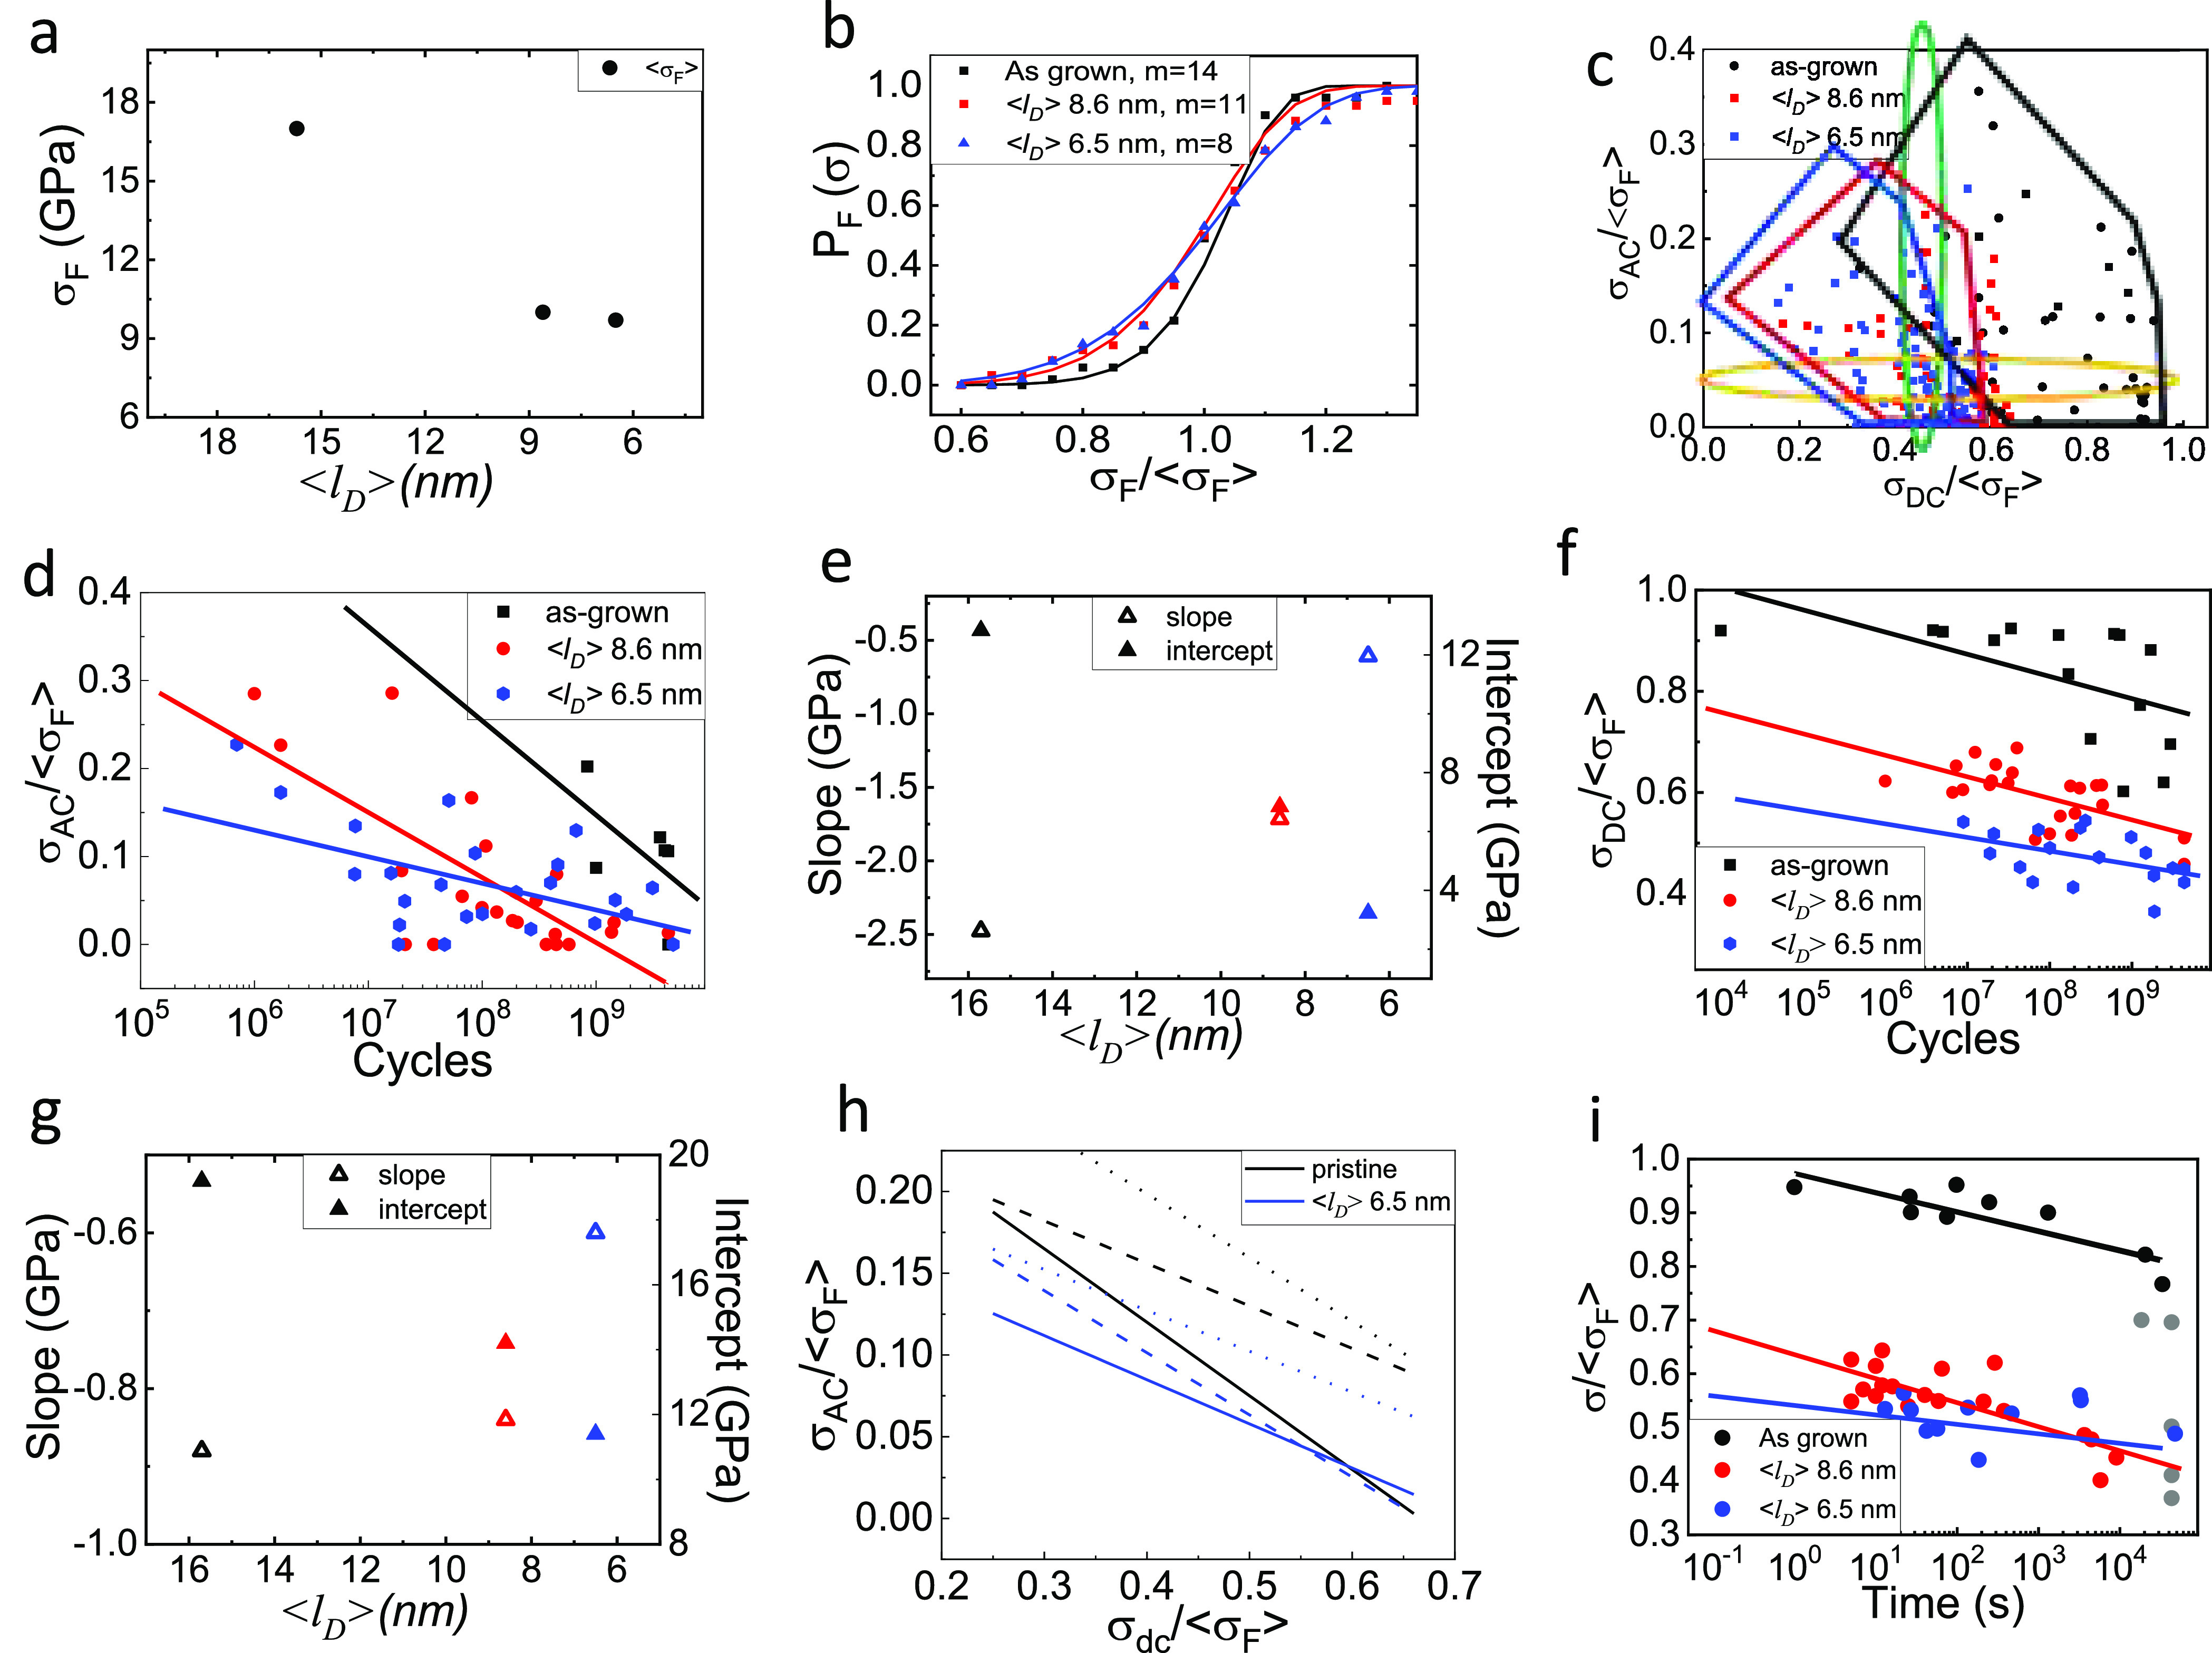
Figure 3.

(a) Breaking strength as a function of mean distance between defects. (b) Survival probability and Weibull fitting for as-grown drumheads and those with two consecutive irradiation doses. (c) Goodman diagram showing all results in as-grown and irradiated drumheads. Green and yellow regions indicate the data selected for plots in panels d and f, respectively. (d) Data obtained with a constant σDC of 0.45⟨σF⟩ and varying σDC. (e) Intercept and slope of the linear fittings in panel d. (f) Data obtained with a constant σAC of 0.05⟨σF⟩ and varying σDC. (g) Intercept and slope of the linear fittings in panel f. (h) Goodman lines for drums that did not break (solid line), those that failed at 109 cycles (dashed lines), and microdrums fractured at 108 cycles for as-grown (black) and irradiated sample with ⟨ld⟩ = 6.5 nm (blue). (i) Static fatigue lifetime of microdrums with different defect densities. Solid lines are linear fits to the data of the coresponding color.
