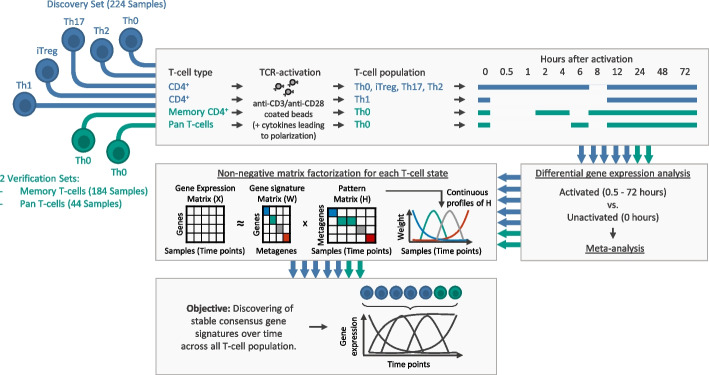
Fig. 1.
Workflow for discovering and verifying of temporal consensus gene expression signatures of T-cells. We analyzed transcriptome data from T-cells after in vitro activation with anti-CD3/anti-CD28 coated beads (Th0) or in the presence of stimulation beads and differentiating cytokines (polarization towards Th1, Th2, Th17, and iTreg T-cell fates). For each T-cell population, we performed DGEA to find DE (FDR < 0.05) genes of activated T-cell populations at different analysis time points compared to unactivated T-cell populations (time series of gene expression arrays and RNA-seq data). To find DE genes with a significant combined effect size (FDR < 0.05) across CD4+ T-cell populations from the Discovery Set (highlighted in blue), we conducted a meta-analysis. Only DE genes with a significant combined effect size in at least one contrast (0.5 to 72 h vs. 0 h) across the available populations (4 populations for time course 0.5 to 6 h of activation, 5 populations for time course 12 to 72 h of activation) were used for NMF. We conducted NMF to infer expression changes over time and to discover stable continuous metagenes (i.e., sets of genes with similar expression patterns across the analysis time points) across all T-cell populations. For verification of the temporal consensus gene signature, we analyzed 2 independent RNA-Seq datasets (highlighted in green). The Discovery- and Memory T-cell Verification Set are based on publicly available datasets

