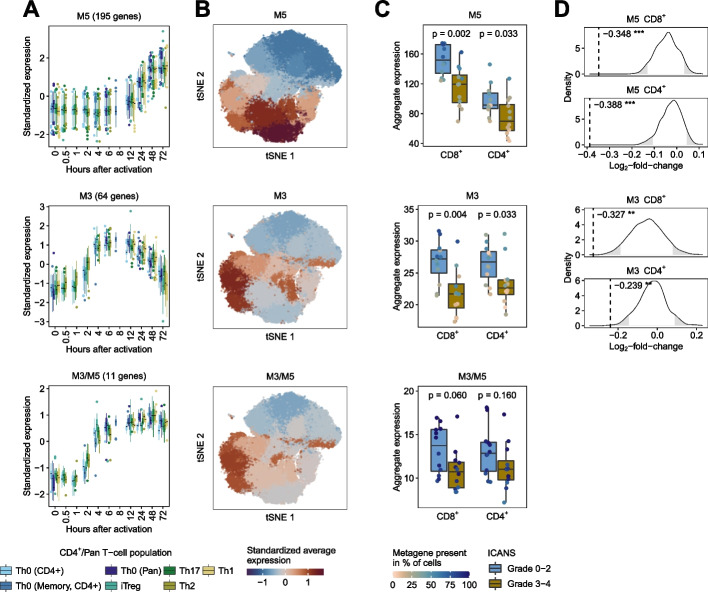
Fig. 6.
Re-analysis of data scRNA-Seq data of autologous anti-CD19 CAR T-cell infusion products from 24 patients with LBCL. A–C Metagenes with at least 10 genes among the most highly variable genes in the scRNA-Seq dataset were analyzed. A The boxplots in the left panel show grouped consensus expression profiles over the course by genes associated with identity and shared metagenes. Each boxplot represents one T-cell population from the Discovery and Verification Sets. The y-axis depicts the standardized median expression of genes from samples with identical analysis time points. The number in brackets above the boxplots indicates the number of highly variable genes of the metagene present in the scRNA-Seq data. B We embedded CD8+CD4− and CD8−CD4+ T-cells from 24 patients into a two-dimensional space by the t-distributed stochastic neighbor embedding (tSNE) method. The colors indicate the standardized average expression of the metagenes for each cluster (the same value is assigned to all cells in a cluster). C For each metagene and patient, we calculated aggregated expression (summed average expression) for CD8+CD4− and CD8−CD4.+ cells. Differences in aggregated expression between patients with low- and high-grade ICANS were evaluated using the Wilcoxon rank-sum test. The colors of the dots in the boxplots indicate the percentage of cells for each patient in which the corresponding metagene is present. We considered a metagene as present in a cell if at least 25% of all associated genes had at least one UMI count. D For each metagene and T-cell population that was significant (p < 0.05) in the Wilcoxon rank-sum test, we generated a null distribution in order to confirm the results (see the “Methods” section). Dashed vertical lines indicate median log2 fold change of aggregated expression between low- and high-grade ICANS patients of the metagene. Rejection regions (empirical p-value < 0.05) are highlighted in grey (* p < 0.05, ** p < 0.01, *** p < 0.001)

