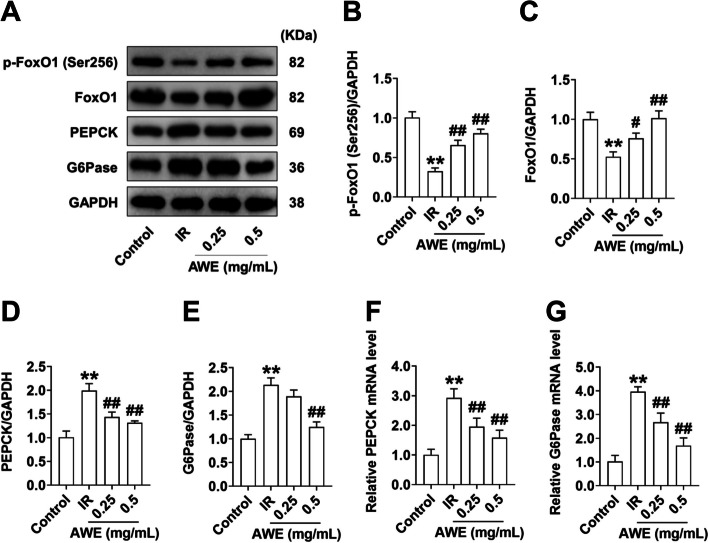
Fig. 4.
AWE inhibited the expression of key genes involved in gluconeogenesis in IR HepG2 cells. HepG2 cells were exposed to 0.2 mM PA in the absence or presence of 0.25 mg/mL and 0.5 mg/mL AWE for 24 h and then incubated with 100 nM insulin for 30 min. A Representative Western blot images of p-FoxO1(Ser256), FoxO1, PEPCK, G6Pase, and GAPDH. B-E Quantitative analysis of p-FoxO1(Ser256) (B), FoxO1 (C), PEPCK (D), G6Pase (E). GAPDH is used as a loading control for protein normalization. F&G Relative mRNA expression of PEPCK (F) and G6Pase (G) was quantified by qRT-PCR. mRNA levels of target genes were normalized to GAPDH. The data are expressed as mean ± SD. n = (3—6) per group. **P < 0.01 vs. Control group. #P < 0.05, ##P < 0.01 vs. IR group. The experiment was repeated three times

