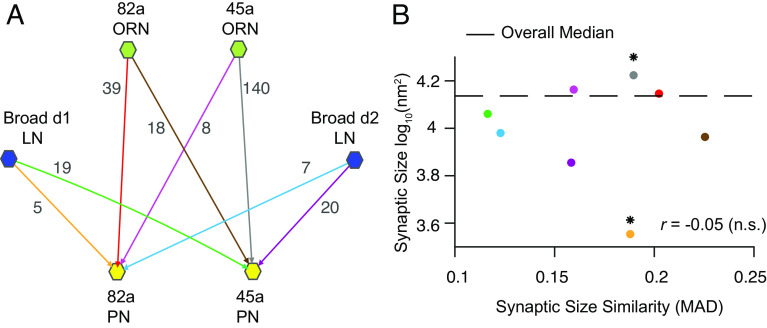
Fig. 1.
Circuit connectivity and connectomic mapping of the plasticity-consistent circuit fraction. (A) Scheme of the subcircuit of AL studied, with available ORN (green hexagon)-PN (yellow hexagon) and LN (dark blue hexagon)-PN connections. Lines and arrowheads represent connections found in AL, where each line and arrowhead have a unique color. The number of synaptic areas available per connection is indicated next to the corresponding line and arrowhead. (B) Distribution of median synaptic size (log-transformed data) and synaptic size similarity, with synaptic size similarity quantified by the median absolute deviation (MAD) for all synaptic pairs; each dot corresponds to connection pair. Color coding as in A. The star sign indicates statistical significance on synaptic size differences, P < 0.0125, after Bonferroni’s correction. Pair-wise statistical analysis using permutation and Kolmogorov–Smirnov tests.

