Figure 2.
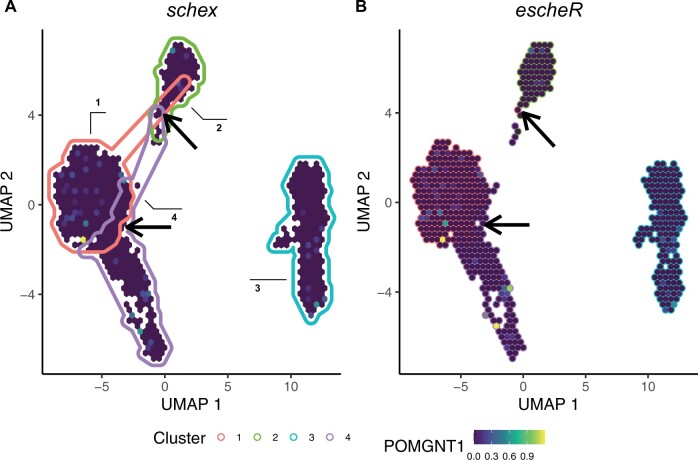
escheR improves multidimensional embedding visualizations. The gene expression of POMGNT1 among peripheral blood mononuclear cells (Hansen et al., 2022) under the UMAP representation. (A) The schex R/Bioconductor package uses color-coded convex hulls to annotate data-driven cell types, creating confusion when interpreting hexagons in overlapping hulls. (B) escheR plots hexagon-specific membership to avoid substantial overlapping of cluster membership. Due to the binning strategy, cautions in interpretation are needed due to possible cluster intermixing within each hexagon.

