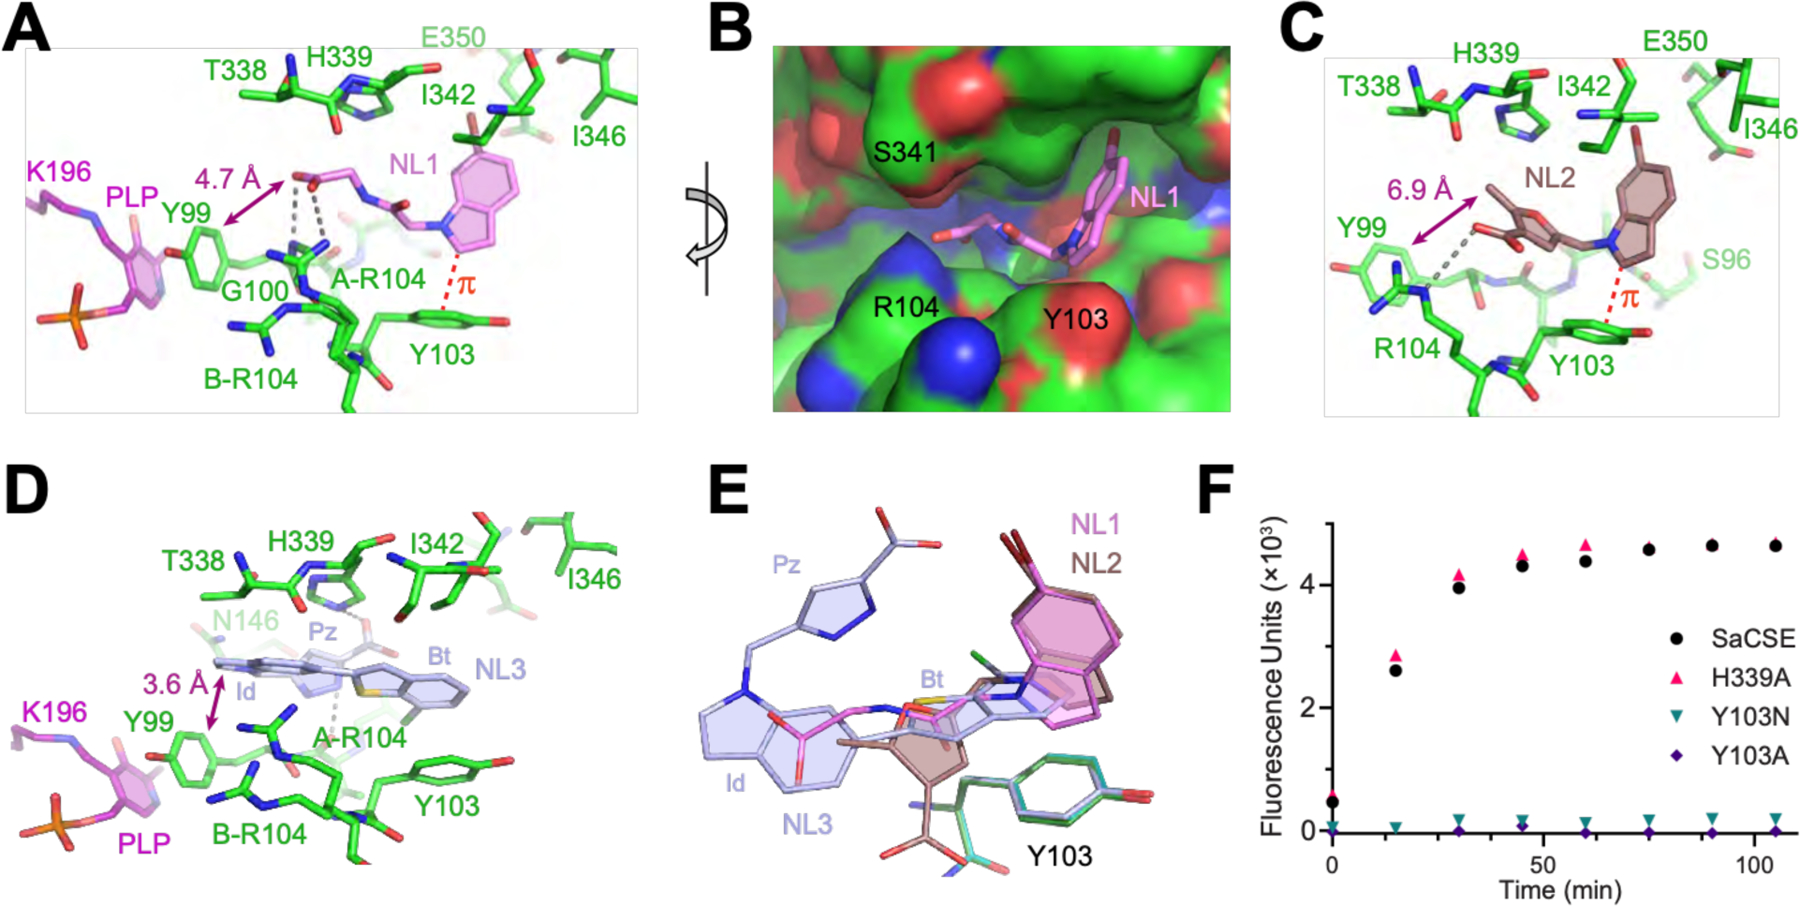
Fig. 3. Co-crystal structures of SaCSE bound to bCSE inhibitors.

(A) Interactions of NL1 (violet) with the SaCSE monomer. Carbon, nitrogen and oxygen atoms are in green, blue and red, respectively. Gray dashed lines depict putative hydrogen bonds. Red dashed line indicates CH-π interactions. (B) View of NL1 (sticks) in the CSE binding pocket (surface representation). (C) Details of NL2 (brown) binding. (D) Details of NL3 (light blue) binding. Benzothiophene (Bt), indole (Id) and pyrazole (Pz) moieties of NL3 are indicated. (E) Bound leads (same colors) after all-atom superposition of the lead-bound structures shown with Y103 from the NL1-, NL2-, and NL3-bound structures (green, cyan, and light blue, respectively). (F) Representative data for the H2S generating activity of SaCSE mutants evaluated by the fluorescence assay.
