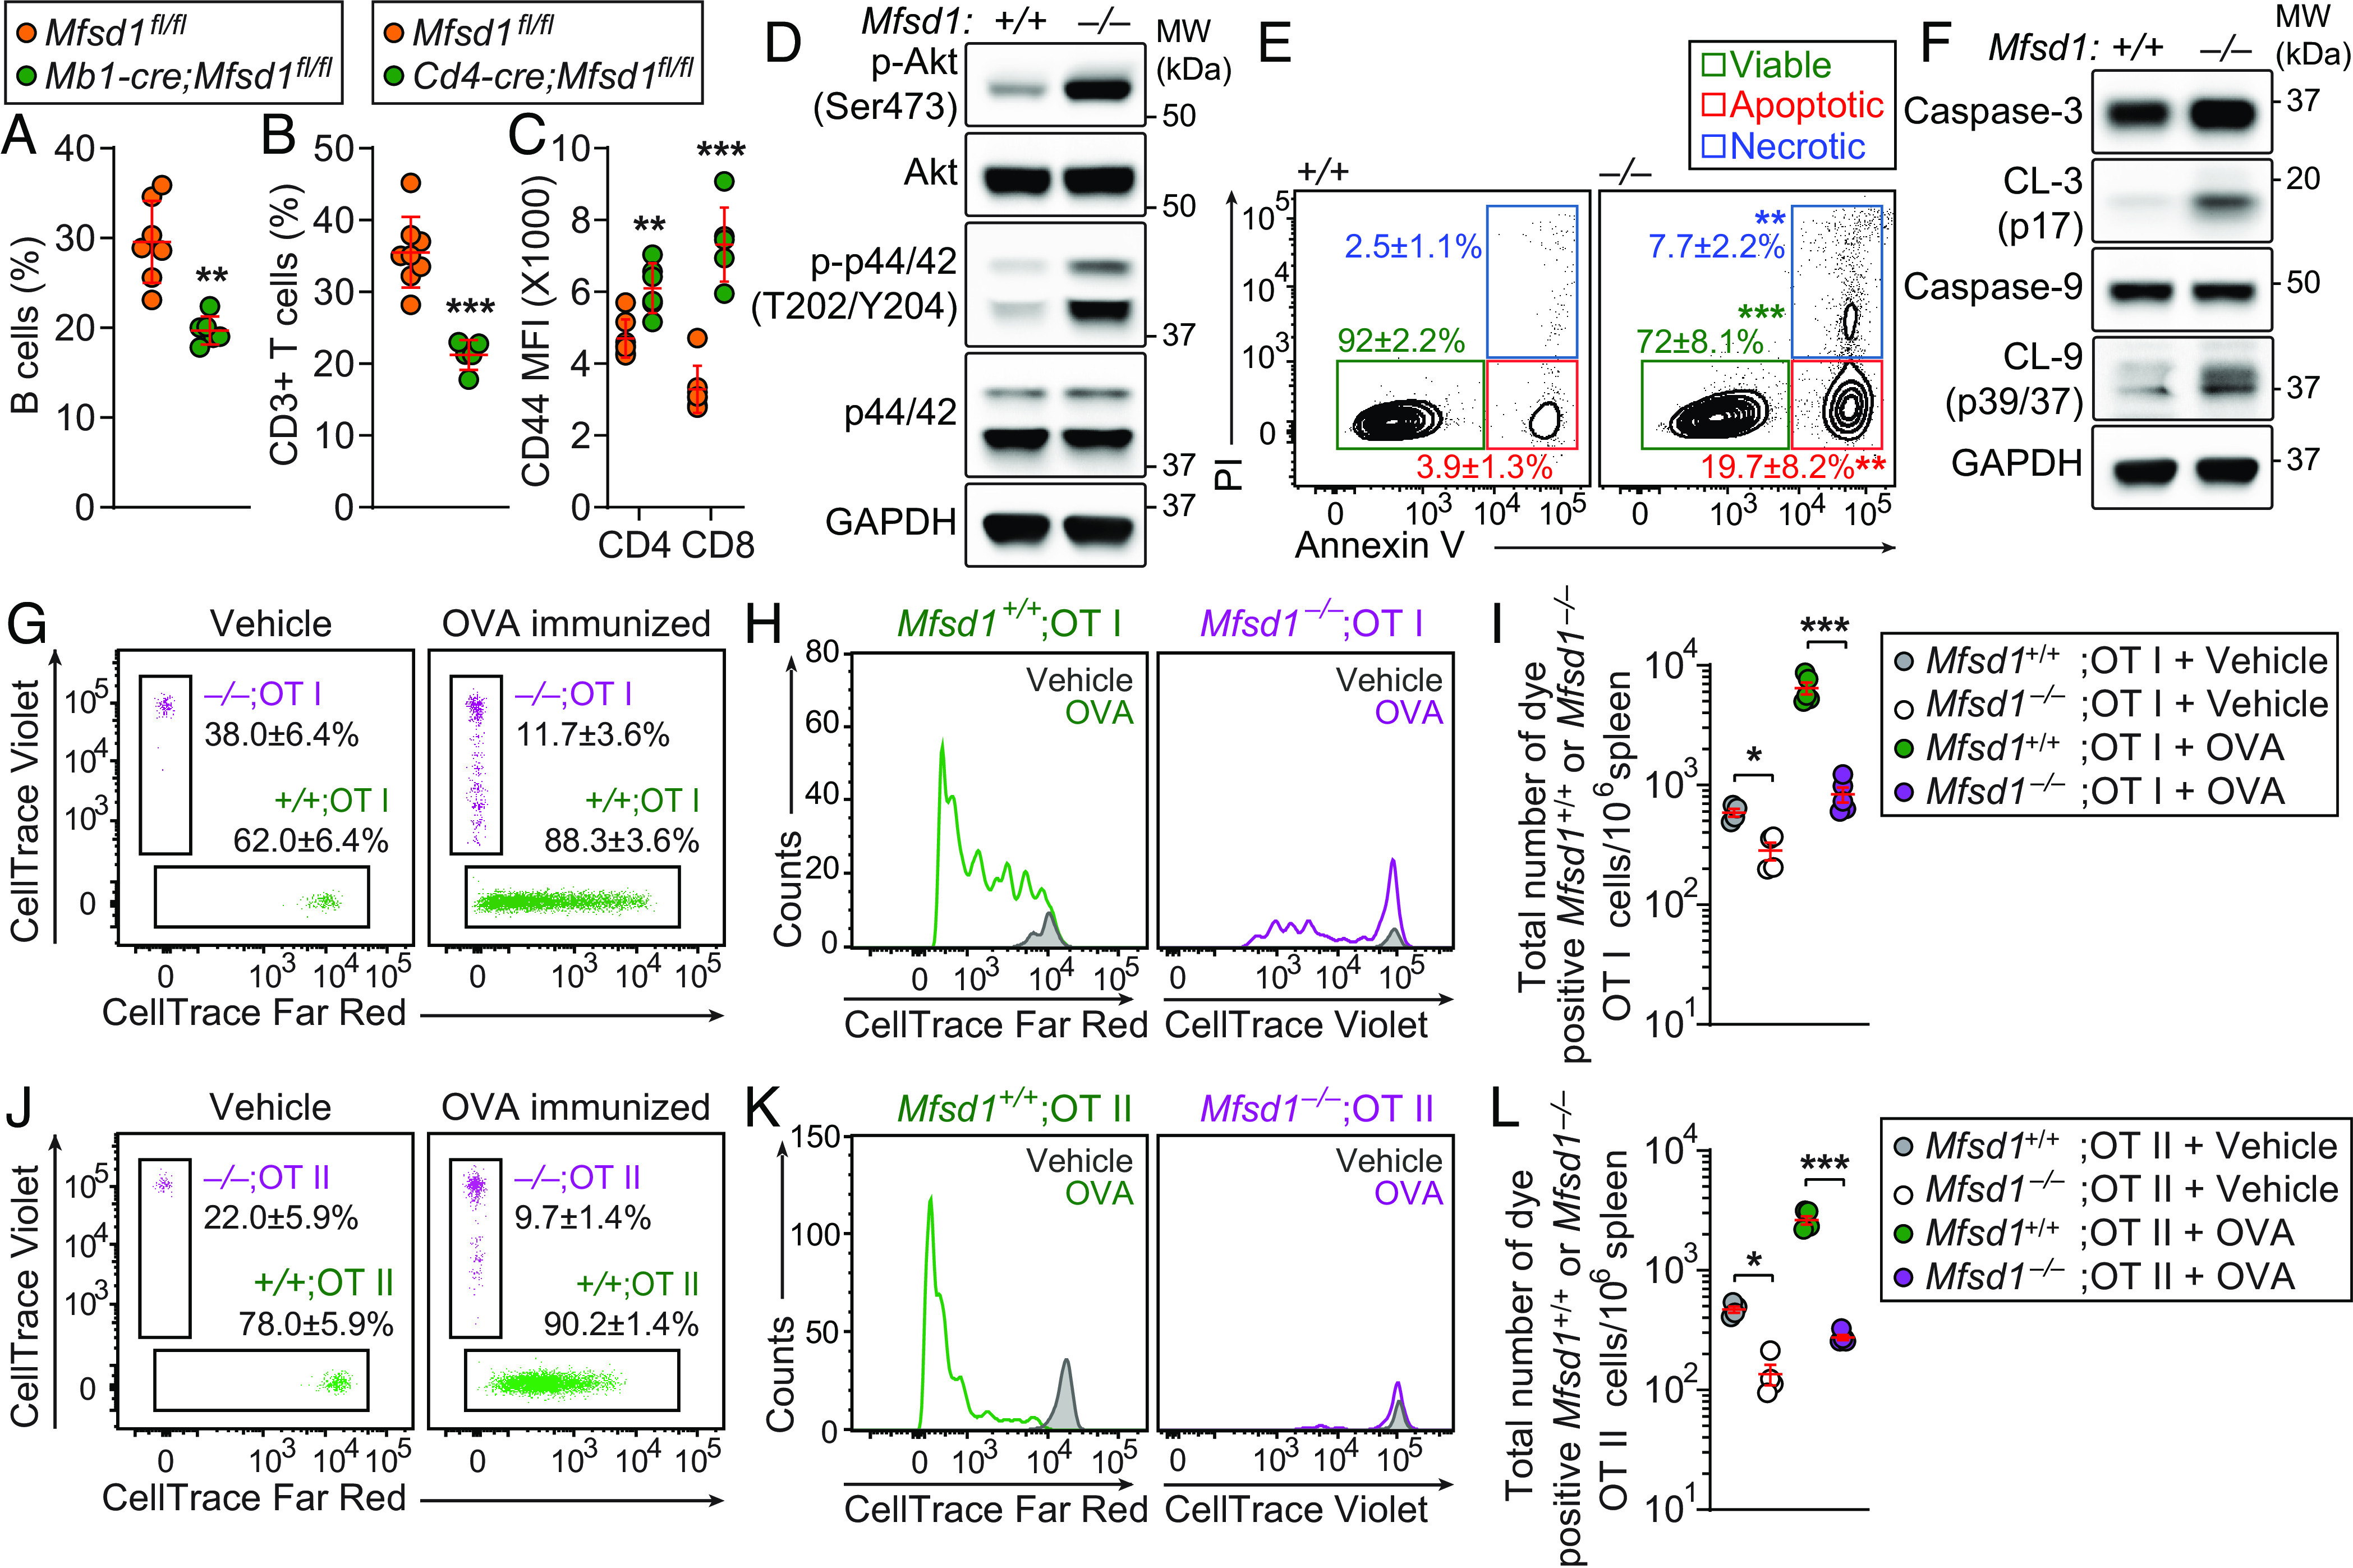
Fig. 2.

Cell-intrinsic MFSD1 function in T cell survival, homeostasis, and expansion. (A–C) Flow cytometry analysis of B220+ B cells (A), CD3+ T cells (B), and surface CD44 expression (mean fluorescence intensity, MFI; C) on CD3+ T cells in peripheral blood of 12-wk-old Mb1-cre;Mfsd1fl/fl or Cd4-cre;Mfsd1fl/fl mice (n = 5 to 8 mice/genotype). (D) Immunoblot analysis of phospho-Akt, Akt, phospho-p44/p42 MAPK, p44/p42 MAPK, and GAPDH in total cell lysates of splenic CD8+ T cells isolated from Mfsd1−/− or wild-type littermates. (E) Annexin V/PI staining of CD3+ T cells in peripheral blood obtained from 12-wk-old Mfsd1−/− or wild-type littermates (n = 6 to 7 mice/genotype). Numbers adjacent to outlined areas indicate percent cells (mean ± SD) in each. (F) Immunoblot analysis of caspase-3, cleaved caspase-3 (CL-3), caspase-9, cleaved caspase-9 (CL-9), and GAPDH in total cell lysates of splenic CD8+ T cells isolated from Mfsd1−/− or wild-type littermates. (G–L) Impaired antigen-specific expansion of MFSD1-deficient T cells. A 1:1 mixture of CellTrace Violet-labeled Mfsd1−/− (CD45.2) and Far Red-stained Mfsd1+/+ OT-I or OT-II T cells (CD45.2) was adoptively transferred into wild-type hosts (C57BL/6J; CD45.1). Representative flow cytometric scatter plots (G and J) and histograms (H and K), and quantification of total numbers (I and L) of CellTrace Violet- or Far Red-positive Mfsd1+/+ or Mfsd1−/− OT-I (G–I) or OT-II T cells (J–L) harvested from the spleens of wild-type (C57BL/6J; CD45.1) hosts, 96 h after immunization with soluble OVA or sterile PBS (vehicle control; n = 4 to 5 mice/group). Numbers adjacent to outlined areas indicate percent cells in each. Each symbol represents an individual mouse (A–C, I, and L). P values were determined by Student’s t test (A and B) or one-way ANOVA with Dunnett’s multiple comparisons (E, I, and L). Data are representative of two (D–F and G–L) or three (A–C) independent experiments. Error bars indicate SD. *P < 0.05; **P < 0.01; and ***P < 0.001.
