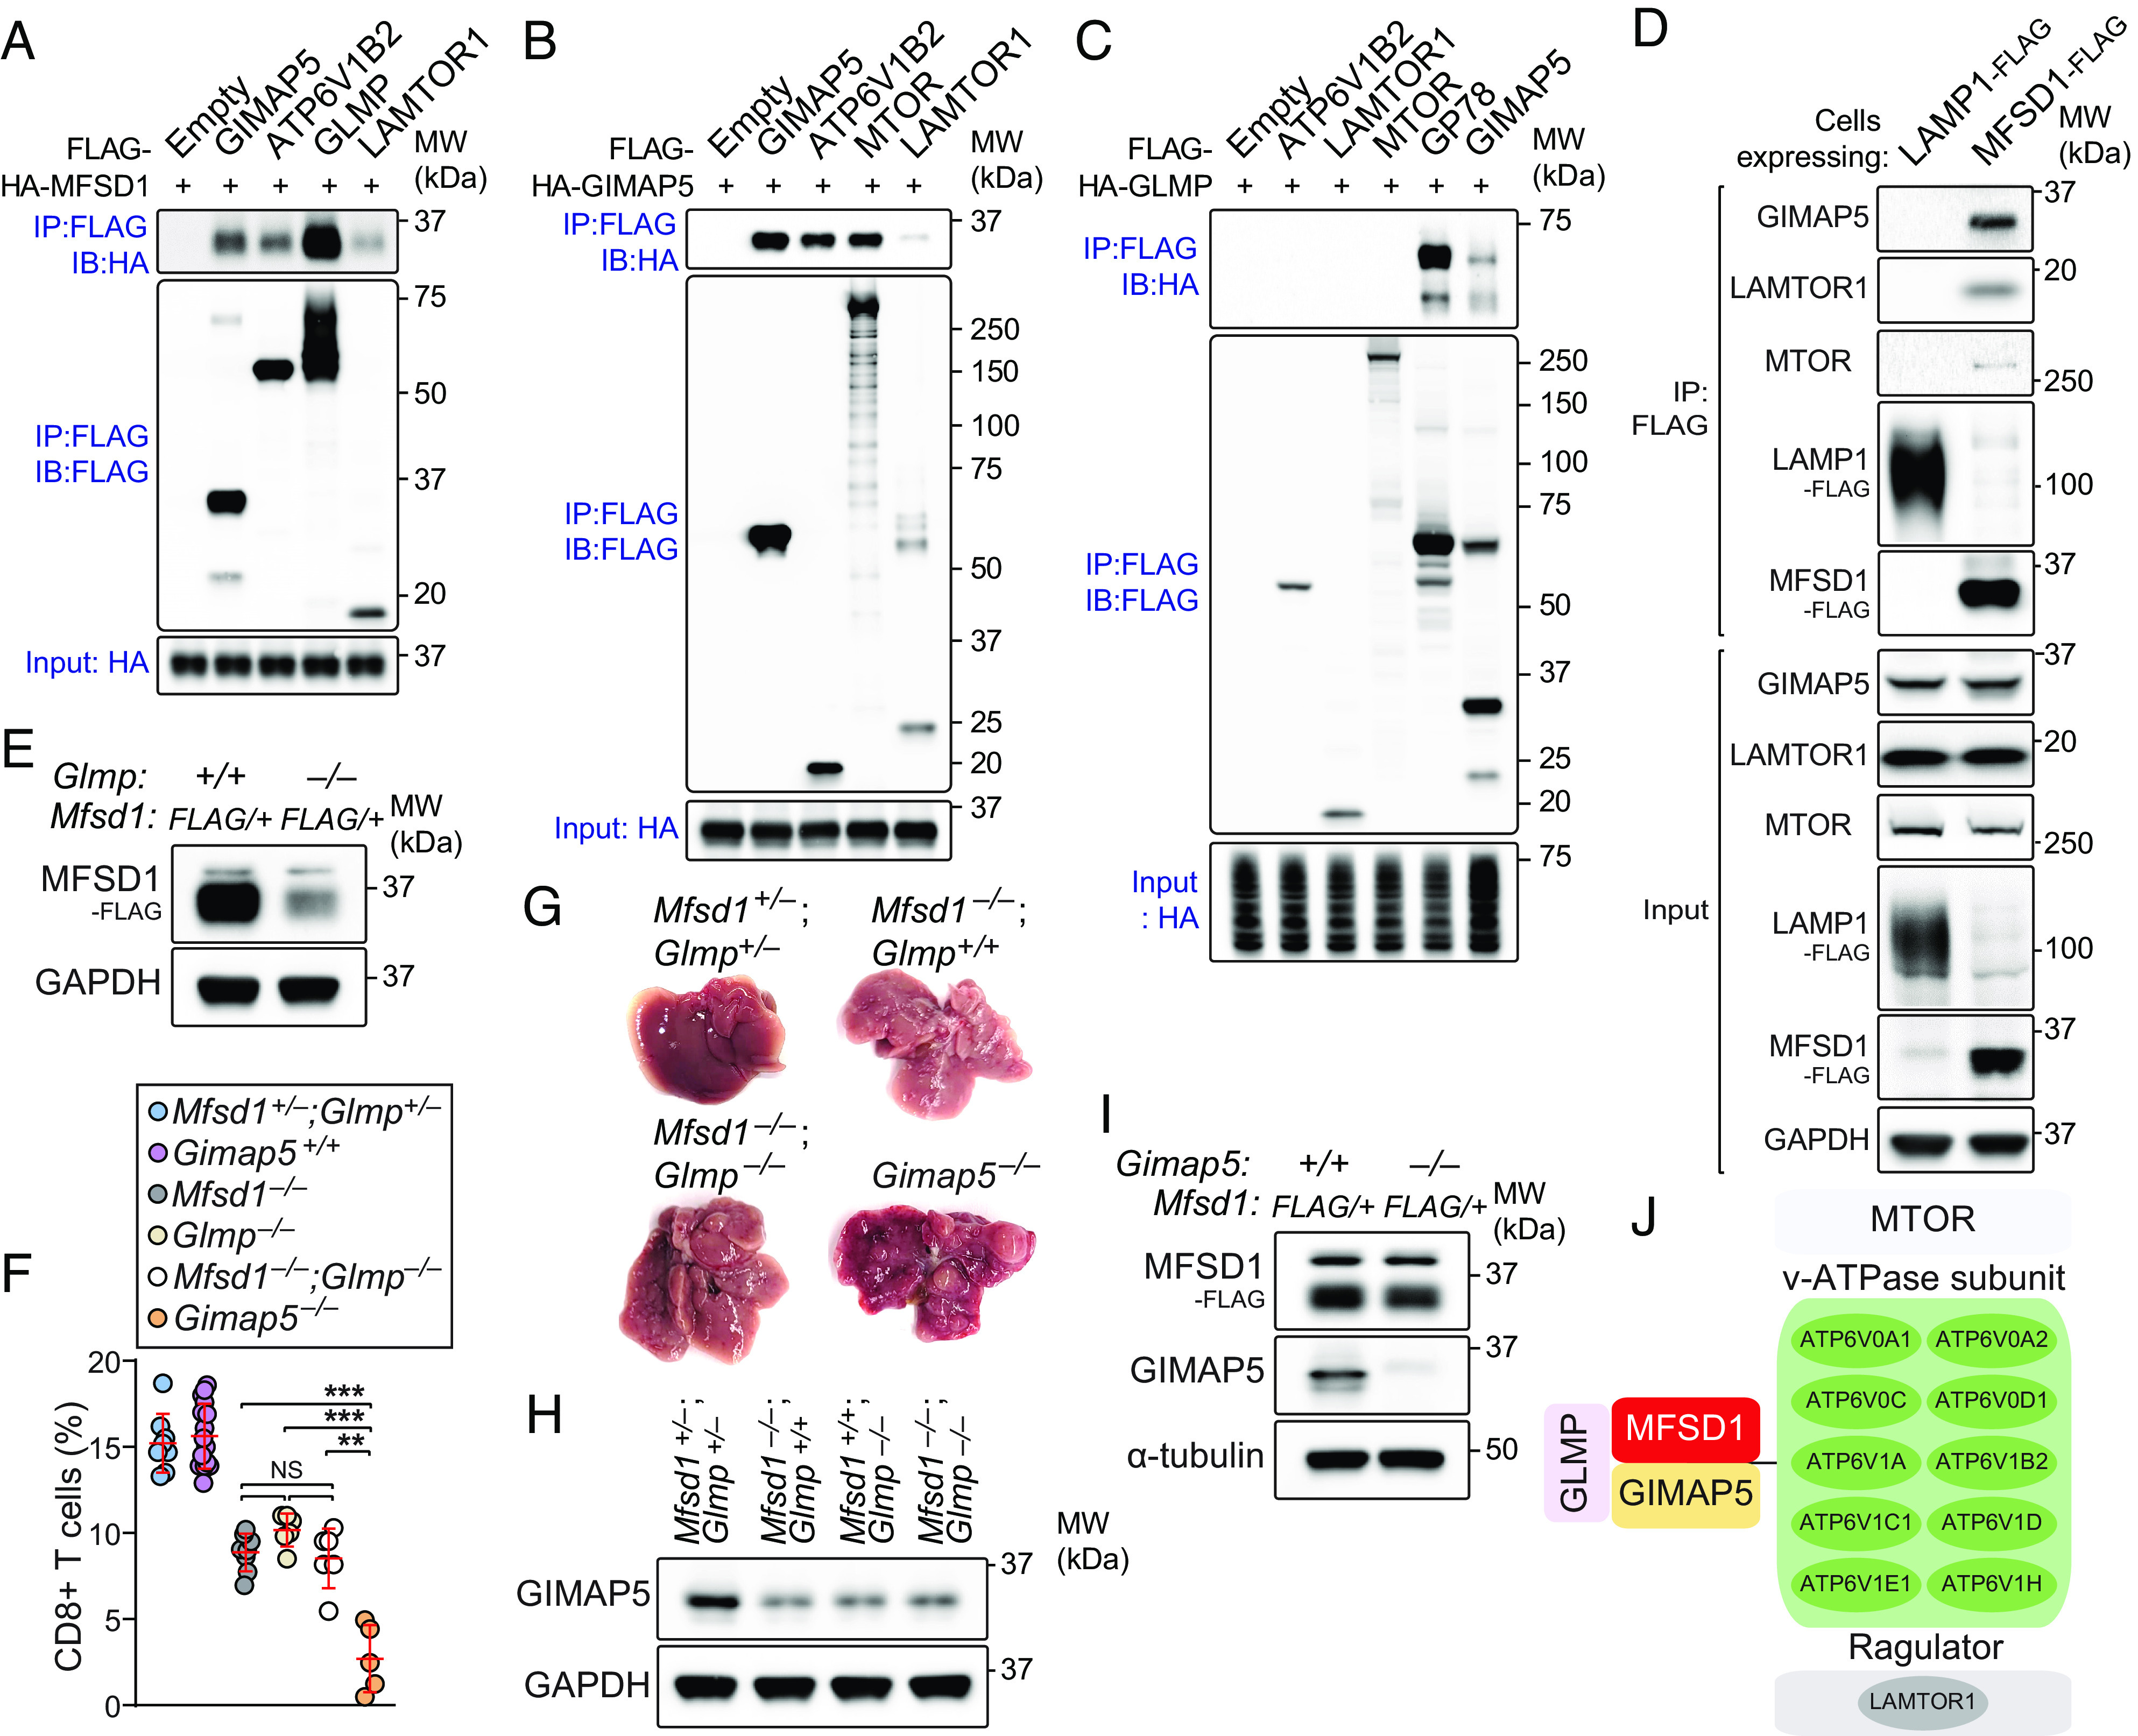
Fig. 3.

Identification of the MFSD1-GLMP-GIMAP5 complex. (A–C) HEK293T cells were transfected with FLAG-tagged GIMAP5, ATP6V1B2, GLMP, LAMTOR1, MTOR, GP78, or empty vector or with HA-tagged MFSD1, GIMAP5, or GLMP. Lysates of FLAG-expressing and HA-expressing cells were mixed as indicated and subsequently immunoprecipitated using anti-FLAG M2 agarose and immunoblotted with antibodies against HA or FLAG. (D) Recombinant FLAG-tagged MFSD1 coimmunoprecipitated endogenous GIMAP5 and the mTORC1 scaffolding complex proteins. Total cell lysates (TCLs) prepared from EL4 T cells stably expressing MFSD1-FLAG or LAMP1-FLAG (control) were subjected to immunoprecipitation using anti-FLAG M2 agarose beads. TCLs (Input) and immunoprecipitates (IP: FLAG) were analyzed by immunoblotting with the indicated antibodies. (E) Endogenous levels of FLAG-MFSD1 in splenic CD8+ T cells of the MFSD1-3X FLAG knock-in mouse (Mfsd1+/FLAG) on a GLMP-deficient (Glmp−/−) or wild-type background. (F) FACS analysis of CD8+ T cells in peripheral blood of mice with indicated genotype (n = 5 to 16 mice/genotype). (G) Representative photographs of livers isolated from mice with indicated genotype. (H) Immunoblot analysis of GIMAP5 expression in splenic CD8+ T cells isolated from mice with indicated genotype. (I) Endogenous levels of FLAG-MFSD1 in splenic CD8+ T cells of the MFSD1-3X FLAG knock-in mouse (Mfsd1+/FLAG) on a GIMAP5-deficient (Gimap5−/−) or wild-type background. (J) Summary of MFSD1 interactome identified by three independent mass spectrometry experiments. Data are representative of three independent experiments. Each symbol represents an individual mouse (F). P values were determined by one-way ANOVA with Dunnett’s multiple comparisons. Error bars indicate SD. **P < 0.01; ***P < 0.001; and NS, not significant with P > 0.05.
