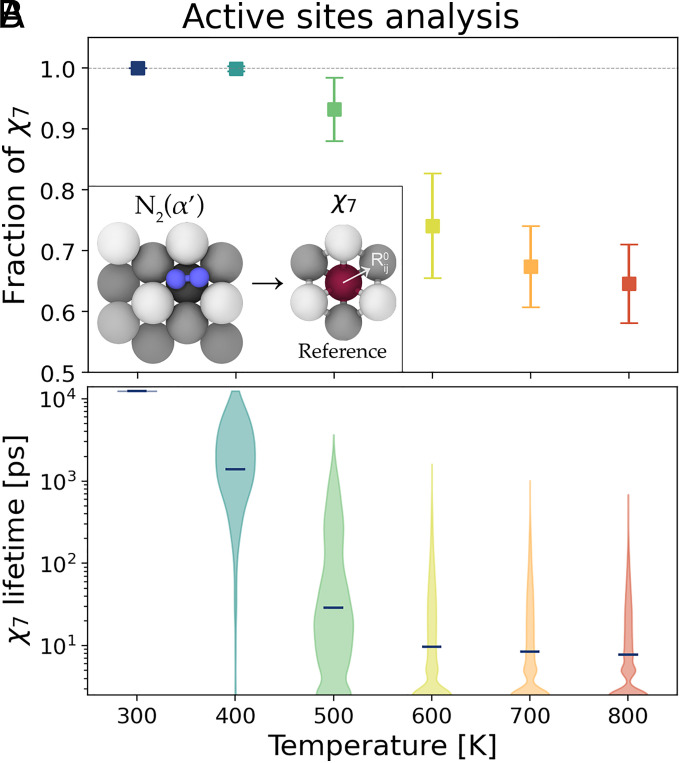
Fig. 5.
Number and lifetime of active sites. (A) Average and SD of the number of sites exposed on the surface with respect to ideal surface. Inset: Construction of reference environment from the adsorption site. (B) Violin plot with the distribution of lifetimes of sites. Line markers identify the average lifetime, while the width describes the distribution of the points.

