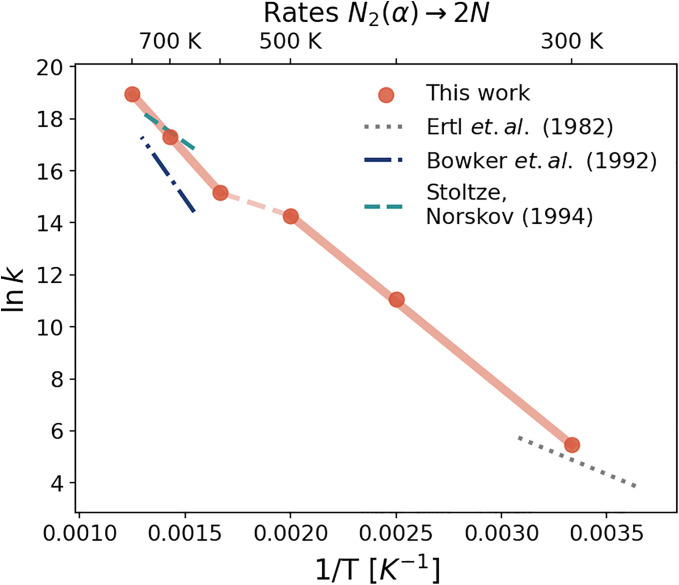
Fig. 8.
Kinetic rates for the step. Logarithm of the reaction rates as a function of inverse temperature. Red dots indicate the values estimated from the free energy profiles using the Eyring–Polanyi equation. To highlight the existence of two different behaviors, the solid red lines represent linear interpolations of the data in the low (300 to 500 K) and high temperature (600 to 800 K) regimes, while the dashed red line connects the two regimes. Literature data are calculated from the Arrhenius equation , using the pre-exponential factors and the activation energies from refs. 18, 40, and 66. High-temperature data are plotted between 650 and 770 K, while low-temperature data between 275 and 325 K.

