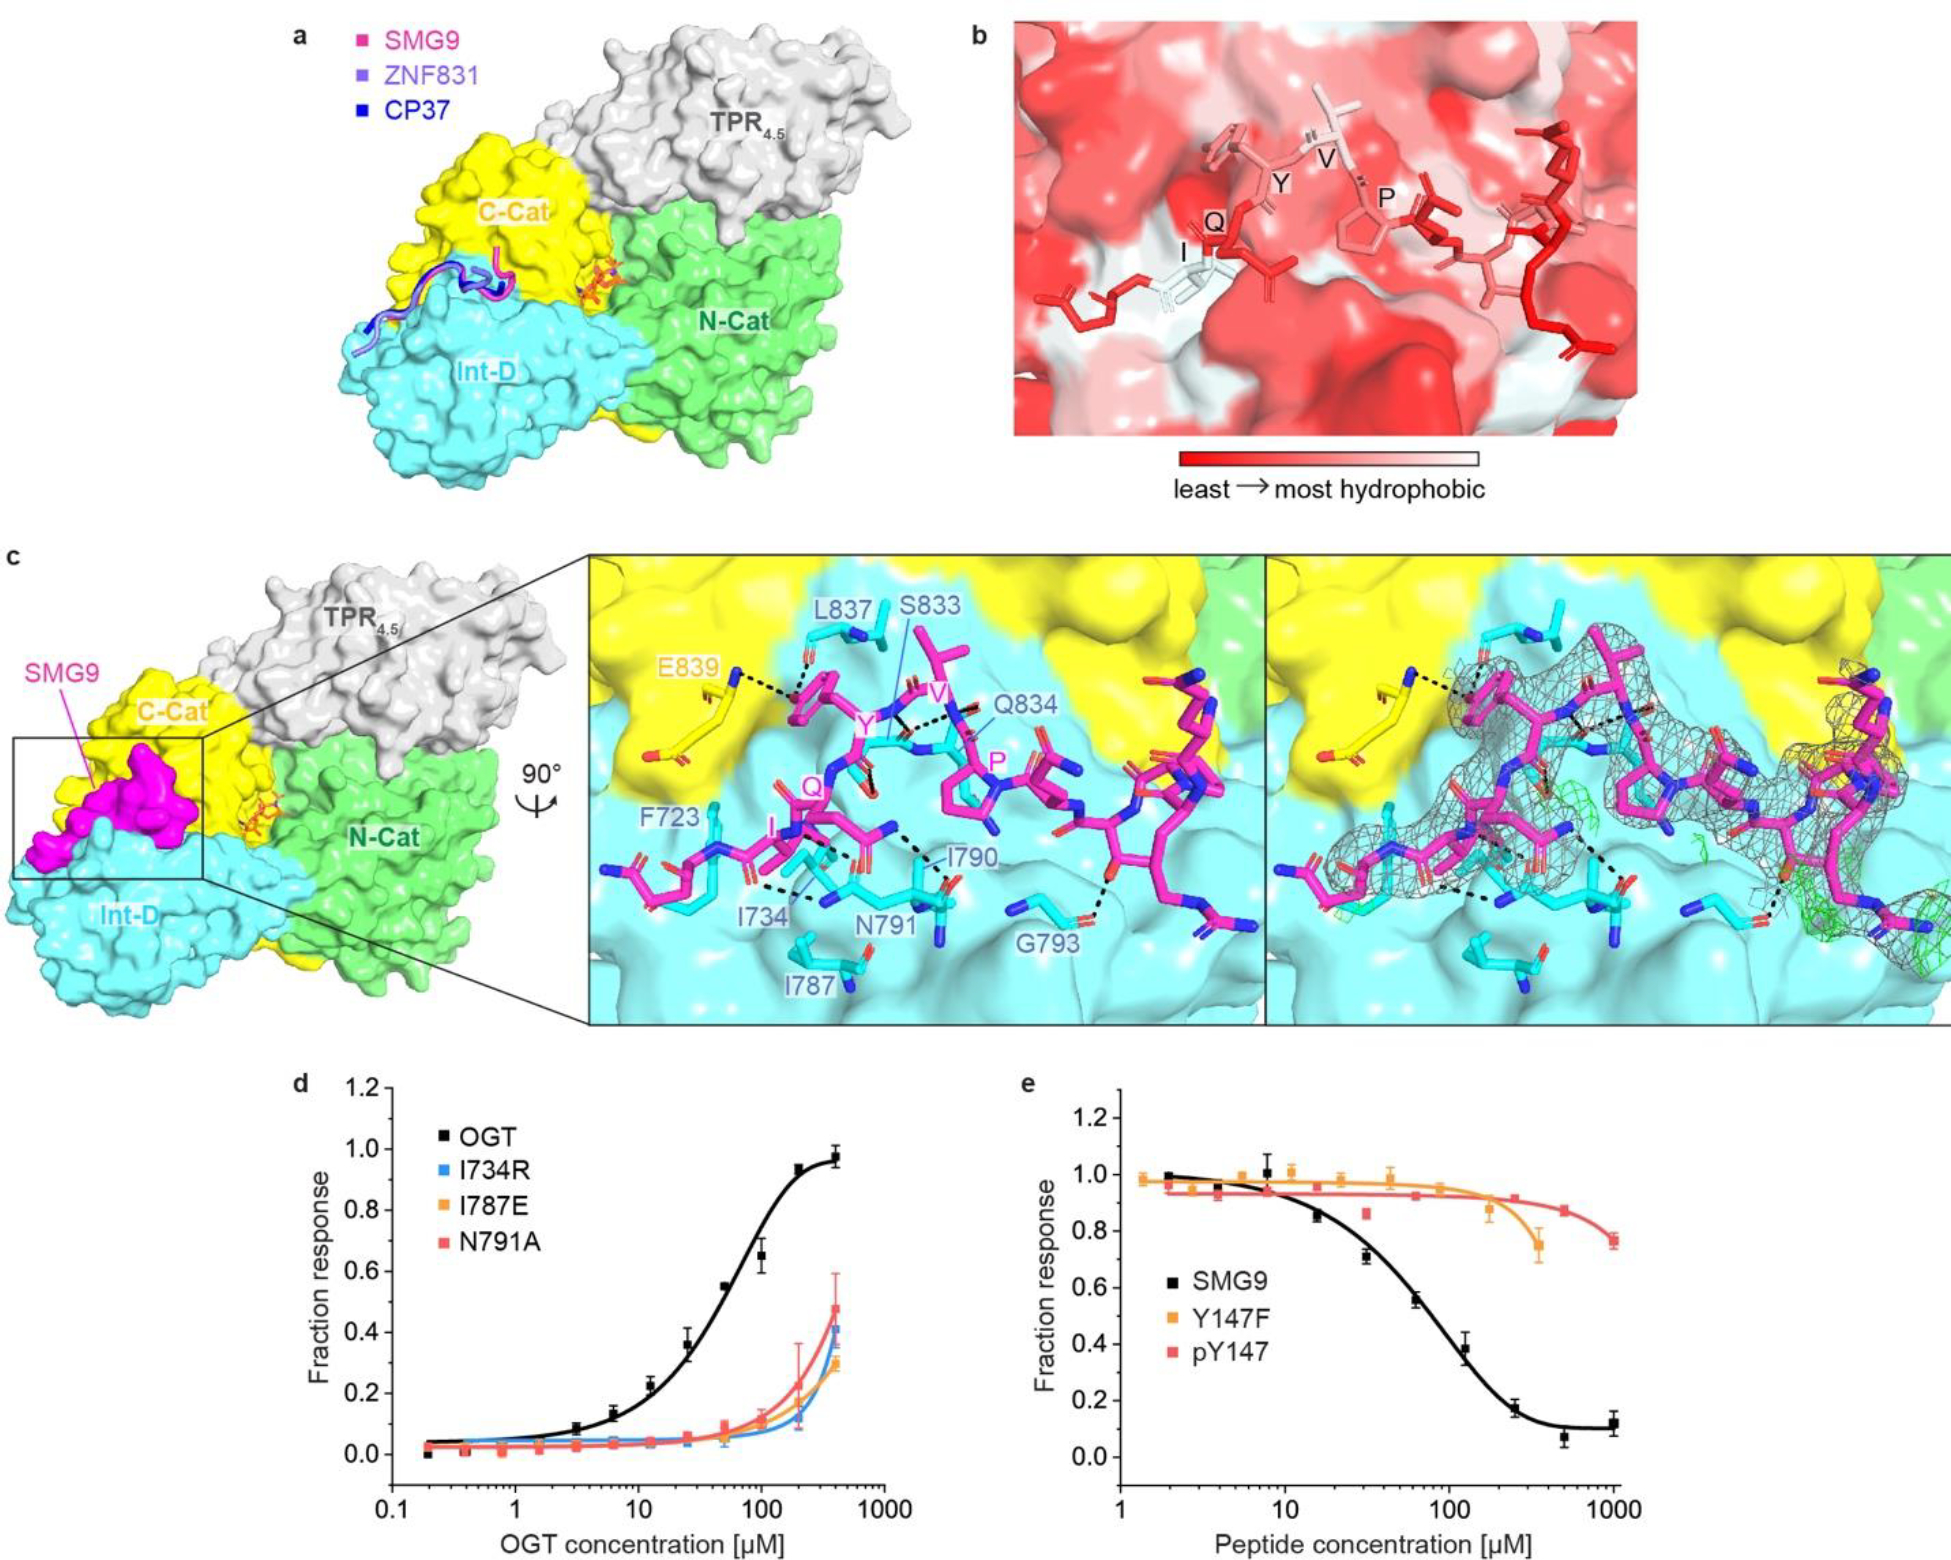
Figure 2. OGT crystal structures reveal a binding site in the Int-D.

(a) OGT4.5 in complex with Int-D-binding peptides and UDP-GlcNAc. SMG9, ZNF831, and CP37 peptides are shown as cartoon in magenta, purple and blue, respectively. Protein domains in OGT4.5 are colored as in Figure 1a. UDP-GlcNAc is shown in orange sticks. (b) Zoom-in view at the Int-D binding site demonstrating hydrophobic interactions between SMG9 peptide (shown as sticks) and Int-D in OGT4.5 (shown as surface). Red to white color scale represent hydrophobicity. (c) Left: surface representation of SMG9 peptide bound to OGT4.5. Right: zoom-in view at the Int-D binding site demonstrating polar interactions between SMG9 peptide (shown as magenta sticks) and Int-D in OGT4.5 (shown as surface) with interacting OGT residues shown in sticks. 2Fo–Fc electron density map of SMG9 peptide is shown as grey mesh and contoured at 1.0 σ, Fo–Fc electron density map is shown as green mesh and contoured at 3.0 σ. (d) Saturation fluorescence polarization (FP) binding assay of fluorescently labeled 5-FAM-SMG9 peptide with wild-type (WT) OGT (black) and mutants I734R (blue), I787E (orange), and N791A (red), n=3. (e) Competitive FP binding assay of WT SMG9 (black), mutant SMG9 Y147F (orange) and phosphorylated SMG9 pY147 (red) peptides with fluorescently labeled 5-FAM-SMG9 peptide binding to OGT, n=3. Data are presented as mean values +/− SD of three replicates.
