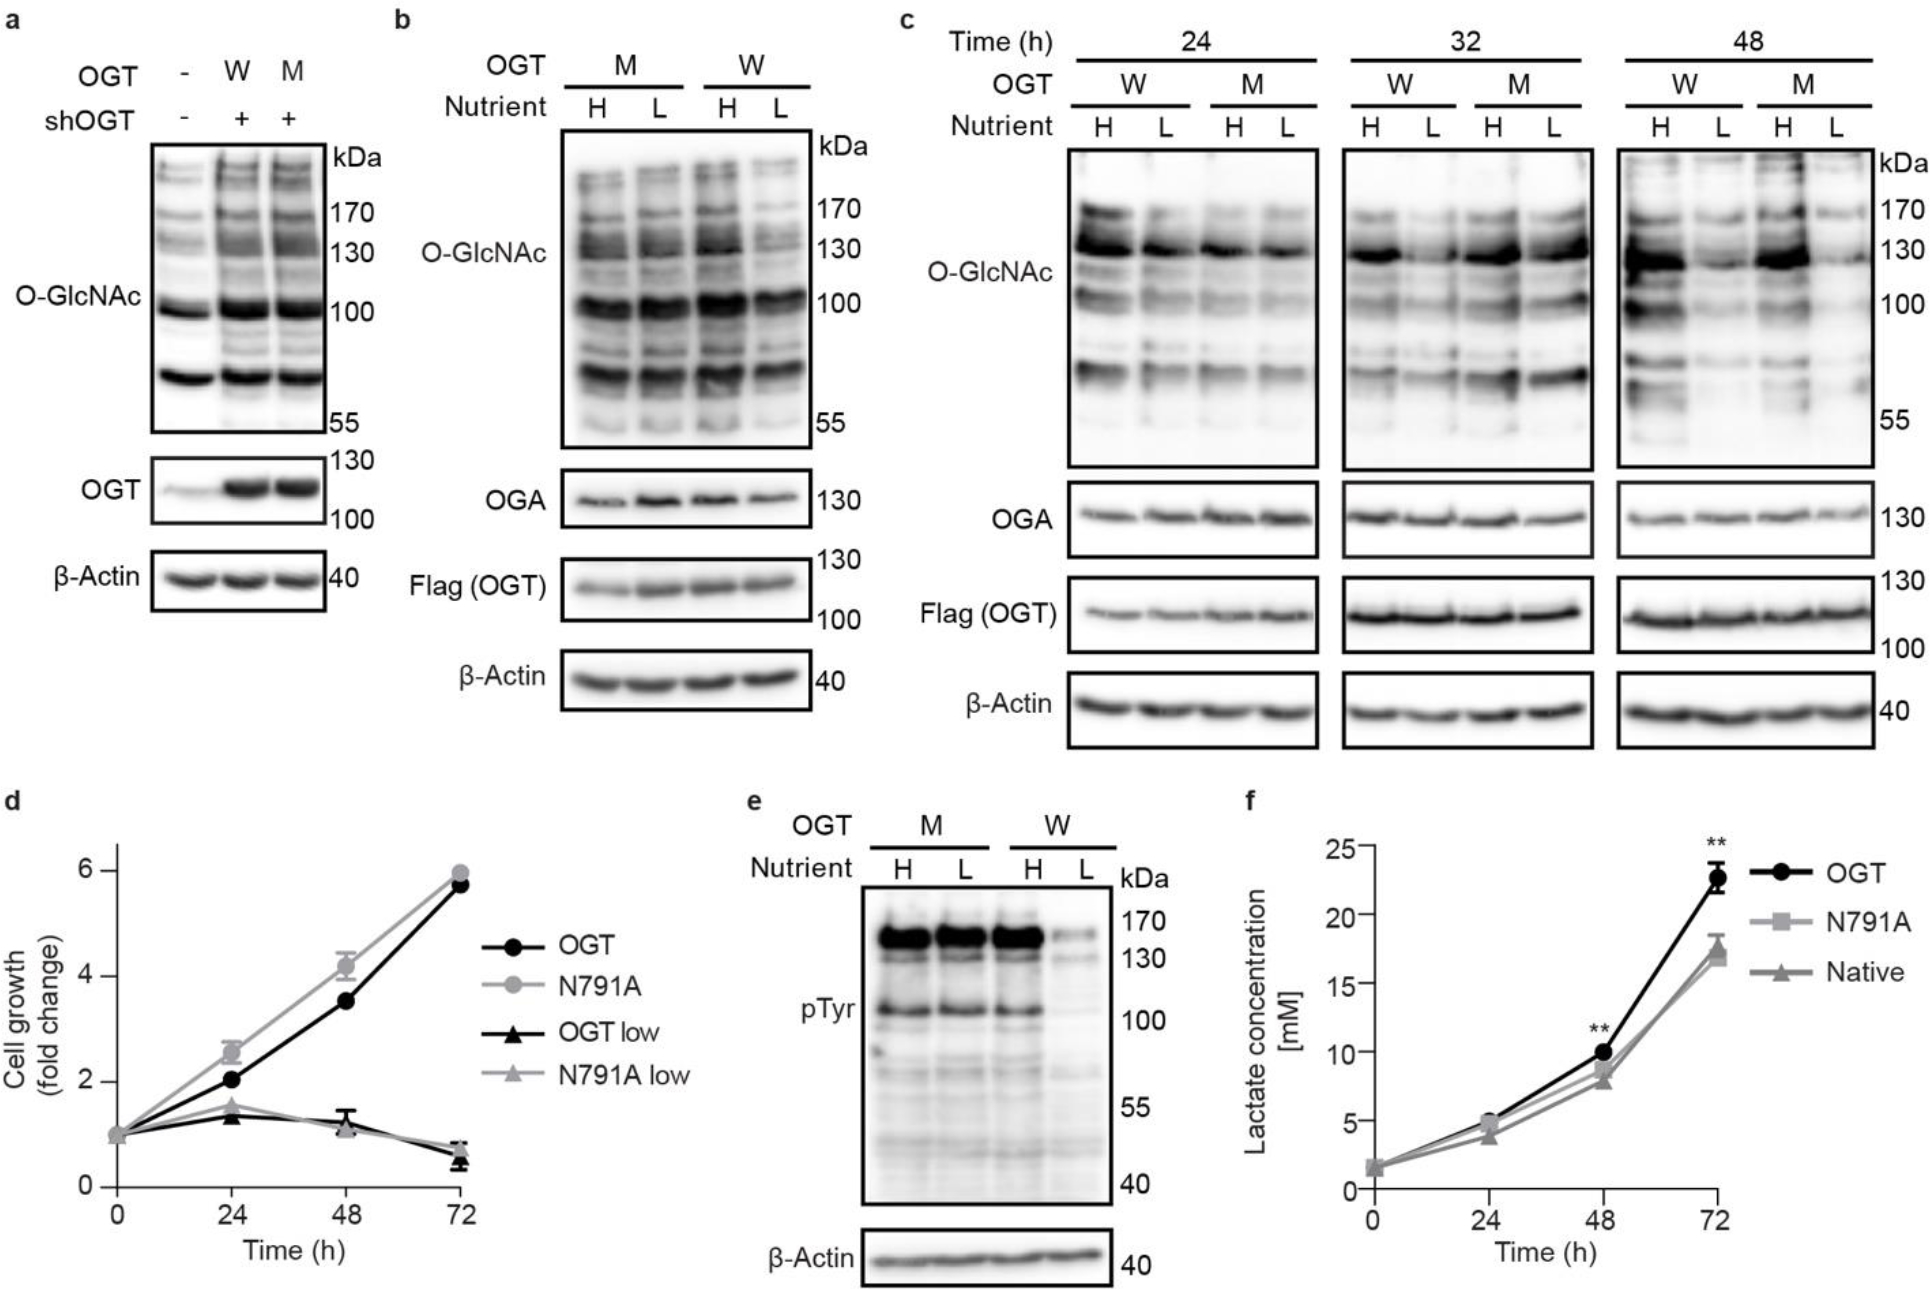
Figure 5. OGT Int-D binding site is a regulator of O-GlcNAc dynamics during nutrient deprivation and lactate production.

(a) Western blot detection of global O-GlcNAcylation in TRex-293 cells overexpressing OGT (W) or OGT-N791A (M) with endogenous OGT knockdown (shOGT). (b) Western blot of O-GlcNAcylation under high (H) and low (L) nutrient conditions with OGT (W) or OGT-N791A (M) overexpression. High nutrient conditions include DMEM with 4.5 g/L glucose and 10% FBS, low nutrient conditions include DMEM with 0.45 g/L glucose and 1% FBS. (c) Western blot showing time course study of O-GlcNAcylation response to a low nutrient condition with OGT (W) and OGT-N791A (M) overexpression. Cells were induced for 48 hours prior to high or low nutrient treatment, then samples were collected at 24, 32, and 48 hours of treatment. (d) Growth rate of cells overexpressing OGT (black lines) or OGT-N791A (gray lines) under high (circles) and low (triangles) nutrient conditions over 72 hours. Data are presented as mean values +/− SD of four biological replicates. No significant difference was detected between cell lines by two-tailed unpaired t-test in either nutrient condition. (e) Western blot of global phosphotyrosine signal from samples treated with the same conditions as panel b. (f) Media lactate concentration from native TRex-293 cells or those expressing WT OGT or N791A after 24, 48, and 72 hours. Lactate concentration, from LactateGlo assay, was normalized to cell number by CellTiter-Glo assay and quantified by lactate standard curve. Conditions were compared by two-tailed unpaired t-test, ** p=0.002. Data are presented as mean values +/− SD of four biological replicates. Western blots are representative of three biological replicates.
