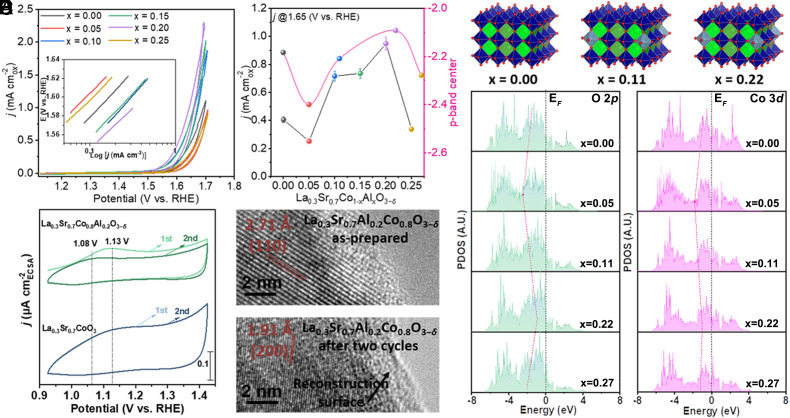
Fig. 3.
OER performances of as-prepared LSCAOs catalysts and electronic interpretation of the effect of Al substitution on surface reconstruction. (A) CV curves of LSCAOs (x = 0; 0.05; 0.10; 0.15; 0.20; 0.25) in O2-saturated 1 M KOH with a scan rate of 10 mV s−1. Inset, Corresponding Tafel plots after oxide surface area normalization, capacitance correction, and iR correction. (B) OER current densities (left axis) of LSCAO at 1.65 V vs. RHE. The O 2p−band centre (right axis) in LSCAOs oxide is plotted to show its correlation with OER activity. (C) Computational models of LSCAOs (x = 0; 0.11; 0.22). (D) The d−band center of Co−3d and p−band center of O 2p PDOS in LSCAOs. (E) Pseudocapacitive behavior in the first and second cycles of LSCO and LSCAO-0.2 during CV cycling. (F) HRTEM images, showing the surface regions for as-prepared LSCAO-0.2 and after two cycles.

